 ← Grupo Aprecisa · Connecting those who know with those who need
Energy and the power system · Engineering · Mathematics · Opinion
Energy Does Not Fit on a Single Ruler
Orders of magnitude, scales and logarithms — from the electricity bill to the European grid
Gaspar do Amaral · 10 October 2026
Translated from the Portuguese original. This version was issued on 27 October 2026.
On this site, this article has been
The scene is imagined, but every family will recognise it.
Sunday lunch. Between the coffee and the pudding, the electricity bill turns up on the table. The granddaughter, who is in the 9th year of school, reads it out: “Contracted power: 6.9 kVA. Consumption this month: 420 kWh.” Her grandfather, a retired electrician, corrects her at once: “The kVA are the power; the kWh are the consumption. It’s not the same thing.” Her uncle, who read something in the paper, joins in: “One of those wind turbines out at sea can power a whole city.” Her cousin, proud of her new car: “My electric car has a 58 kWh battery. That would run the house for a month.” And her father, putting down the newspaper: “And the data centres in Sines will use more than the whole country.”
The whole table nods along to everything. And the answer the table deserves fits on one line: energy does not fit on a single ruler.
This article is that line unfolded. To talk about energy rigorously you do not need to be an engineer, but you do need to know three things that are learnt by the 9th year of school and quickly forgotten: how to tell power from energy, how to climb up and down the ladder of prefixes, and how to choose the right ruler — the ordinary ruler, the 0-to-100 ruler or the logarithmic ruler. At the end, we will go back to the table to see who was right.
In plain language. Some numbers add up (the kilometres of a journey), some numbers are shared out (the slices of a cake, as percentages) and some numbers multiply (the interest on a loan). Each one calls for its own ruler. Many arguments about energy are, at bottom, arguments made with the wrong ruler.
I. Speed and distance: power and energy
The most common mistake in the energy debate is to confuse power with energy. The distinction is the same as between speed and distance. Speed tells you how fast you are going, in kilometres per hour; distance tells you how far you have gone, in kilometres. In energy, power tells you how fast energy is being used or produced, in watts (W); energy tells you how much has been used or produced, in watt-hours (Wh). One watt is one joule per second.

On the bill, the two quantities appear side by side. The contracted power, in kVA, is the home’s “speed limit”: the most you can switch on at the same time without the circuit breaker tripping. The consumption, in kWh, is the “distance” travelled in the month. The kVA measure apparent power; in a home they are almost equal to kW, and for this article they can be read as such.
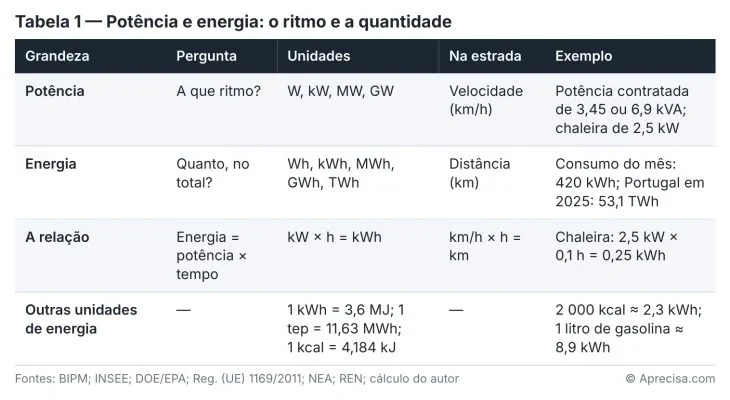
Table 1 lines up the quantities, the units and the road analogy. The column that matters is the last one: anyone who confuses the two middle columns is confusing a speed limit with a journey.
In plain language. A car travelling at 120 km/h has not covered 120 km: it depends on how long it has been driving. A 1,000 MW power station has not produced 1,000 MWh: it depends on how many hours it has been running. Power is the rate; energy is the journey.
II. The ladder of thousands
Energy is measured in numbers that run from the tiny to the gigantic. To avoid writing endless zeros, prefixes are used, defined by the International Bureau of Weights and Measures: kilo (k) = a thousand, mega (M) = a million, giga (G) = a billion (a thousand million), tera (T) = a trillion (a million million). Each step multiplies by a thousand. In 2022, the General Conference on Weights and Measures also added ronna (10²⁷) and quetta (10³⁰) — prefixes that energy does not yet need, but which show how high the ladder goes.
Anyone who has done the 9th year of school knows scientific notation: 1,000 = 10³, a million = 10⁶, a billion = 10⁹. Each prefix is a jump of three in the exponent. Confusing mega with giga is an error of a thousand; confusing kilo with giga is an error of a million.
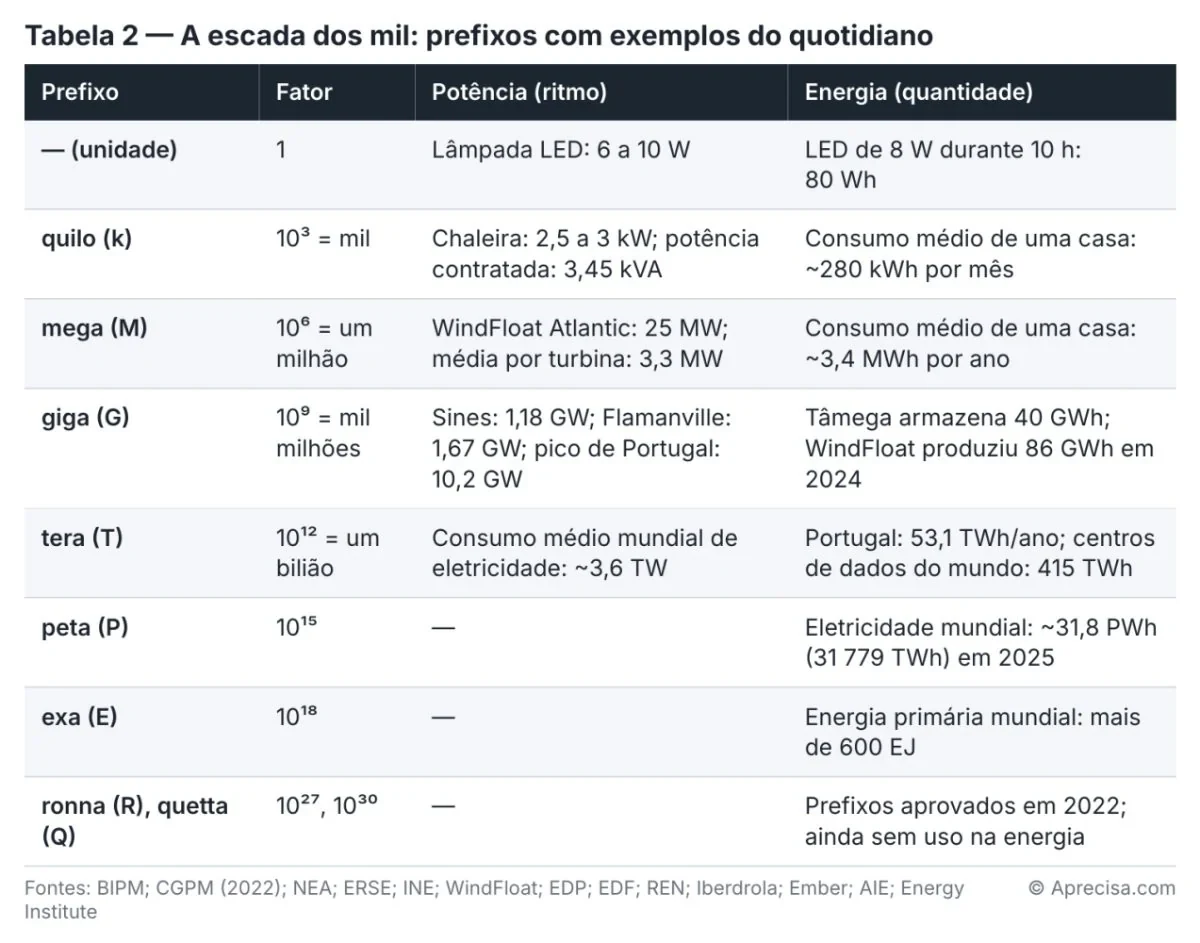
Table 2 puts an everyday example on each step, Portuguese wherever possible. Note that the same prefix works for power and for energy: there are MW and MWh, GW and GWh. The prefix tells you the size; the unit tells you whether it is a rate or a quantity.
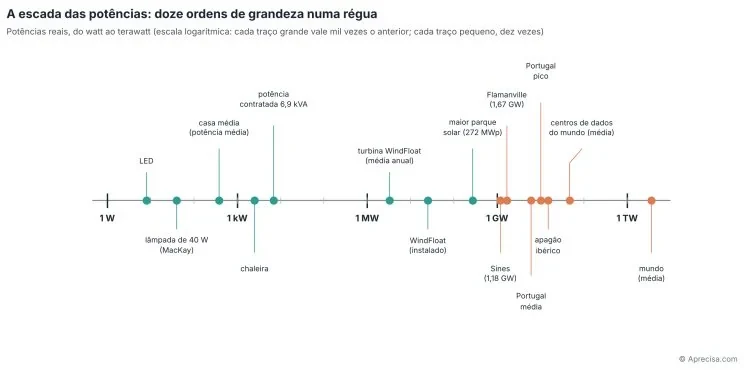
Figure 1 places real powers on a single ruler, from an LED bulb (a few watts) to the planet’s average electricity consumption (about 3.6 TW). Along the way are a kettle, the average consumption of a Portuguese home, an offshore wind turbine, the Sines power station, the Flamanville reactor, Portugal’s average consumption and peak, and the power lost in the Iberian blackout. That is about twelve orders of magnitude. On an ordinary ruler, everything below Portugal would be stuck to zero; on a logarithmic ruler, each step of a thousand takes up the same space and everything fits. It is the only ruler on which the kettle and the country can be seen at the same time.
III. Napkin sums: the order of magnitude
Enrico Fermi, the Italian physicist, was famous for answering any question with a calculation done on a napkin, right to within a factor of ten. The technique has a name — the Fermi estimate — and books devoted to it, such as Guesstimation, by Weinstein and Adam (2008), which describe it as “popular mathematics rounded to the nearest power of ten”. Ärlebäck (2009) showed that Fermi problems are a good way into mathematical modelling at school.
The method has three steps: break the question into smaller questions, round each number to its order of magnitude, and multiply. The answer is not exact, but it tells you whether we are talking about tens, thousands or millions — and that is often enough to decide.
An example. How many turbines like those of WindFloat Atlantic, off Viana do Castelo, would be needed to produce, on average, all of Portugal’s electricity? Portugal consumed 53.1 TWh in 2025; divided by the 8,760 hours of the year, that gives an average power of about 6 GW. WindFloat Atlantic, with three turbines and 25 MW, produced 86 GWh in 2024, that is, about 29 GWh per turbine, equivalent to an average power of 3.3 MW. Six thousand megawatts divided by three-and-a-bit megawatts: about 1,850 turbines. Order of magnitude: thousands, not tens or millions. The sum ignores the fact that the wind does not always blow — and that is where the problem begins, as we saw in “Two Hours in the Late Afternoon” — but it immediately tells you the size of the task.
MacKay (2009) popularised a unit that makes these sums personal: the kilowatt-hour per day per person. An adult’s food, 2,000 kilocalories, is equivalent to about 2.3 kWh per day. The electricity consumed in Portugal in 2025, divided by 11.4 million residents, comes to about 12.7 kWh per day per person — more than five times the energy in food. According to MacKay, a typical British driver uses about 40 kWh a day in fuel.
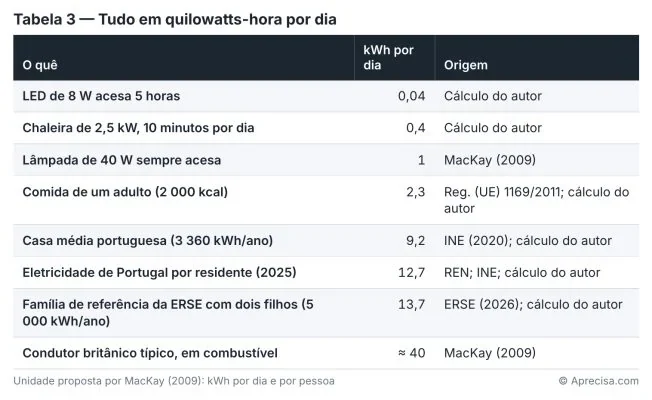
Table 3 translates everything into the same unit, kWh per day. It is the quickest way to see what weighs and what does not: leaving an LED bulb on for a few hours is a rounding error; food, the home and the car are different orders of magnitude.
In plain language. How many grains of rice are there in a kilo? You do not need to count them: you weigh a hundred grains, do a rule of three and get “a few tens of thousands”. It is not the exact number, but it is the number that matters. Energy sums are done like this before they are done properly.
IV. Four ways of measuring
In 1946, the psychologist Stanley Stevens published in the journal Science an article that every engineer should read: “measurement, in the broadest sense, is defined as the assignment of numerals to objects or events according to rules”. And he showed that there are four types of rule, or of scale, and that each one only allows certain operations.
1. Nominal. The numbers, or names, only distinguish: solar, wind, hydro, gas. It makes no sense to say that wind is “bigger” than solar just because it comes later in the list.
2. Ordinal. The numbers put things in order, but the distances do not count. The European energy label, from A to G, is ordinal: an A fridge is better than a B, but the difference between A and B is not the same as the difference between F and G. Since 1 March 2021, the European Union has replaced the A+++ scale with a more demanding A–G scale, and class A started out empty, waiting for better products.
3. Interval. The distances count, but the zero is arbitrary. Temperature in degrees Celsius is an interval scale: going from 10 °C to 20 °C is the same rise as going from 20 °C to 30 °C, but 20 °C is not “twice as hot” as 10 °C.
4. Ratio. The distances count and the zero is real. Kilowatt-hours, watts, euros and kelvin are ratio scales: 2 kWh is exactly twice 1 kWh.
The difference is not academic. The maximum efficiency of a thermal power station, given by Carnot, depends on the ratio between the cold and the hot temperature, and that ratio only makes sense in kelvin. With steam at 600 °C and a condenser at 30 °C, the correct sum, in kelvin, gives a theoretical maximum of about 65%. The same sum done, by mistake, in degrees Celsius would give 95% — an impossible number, born only of using an interval scale where a ratio scale was needed.
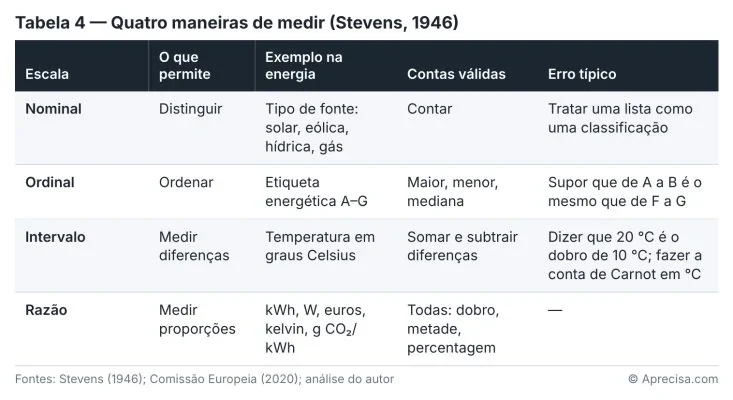
Table 4 sums up the four types of scale, the examples in energy, the operations each one allows and the typical error of anyone who confuses them. The rule of thumb is simple: you can only say “twice as much” when the zero is real.
V. The 0-to-100 ruler
The percentage is the most used ruler in the energy debate, and the most abused. There are three traps.
First: a percentage of what? Renewables supplied 68% of electricity consumption in Portugal in 2025, according to REN. But electricity is only part of the energy the country uses: there is still the diesel of the lorries, the gas of the factories, the petrol of the cars. In gross final energy, the Portuguese renewable share was 36.5% in 2024, according to the DGEG. Both numbers are right; they change because the denominator changes. Worldwide, the difference is even bigger: solar and wind produced about 17% of electricity in 2025, but only about 3.3% of primary energy.
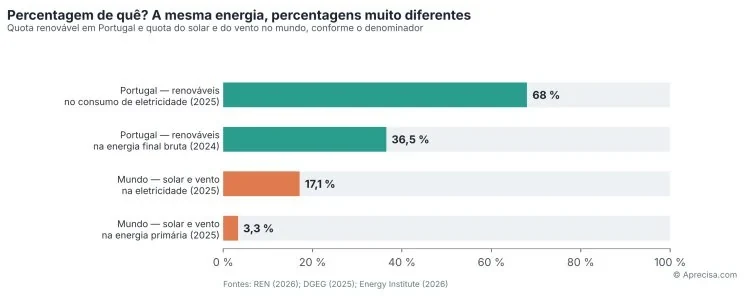
Figure 2 shows four percentages. In the top two bars, Portugal: the renewable share in electricity consumption in 2025 (68%) and in gross final energy in 2024 (36.5%). In the bottom two, the world: the share of solar and wind in electricity in 2025 (about 17%) and in primary energy (about 3.3%). The difference is not a contradiction: in each pair, the first bar measures a slice of a smaller cake, electricity; the second measures the slice of the whole cake, all energy. Anyone who quotes a percentage without saying which cake they are talking about can be telling the truth and misleading at the same time.
Second: percent or percentage points? When the renewable share in production went from 80.5% to 75.6%, it fell by 4.9 percentage points — not by 4.9%. In percentage terms, it fell by about 6%. The UK Office for National Statistics defines it like this: a percentage point is the difference between two percentages; 10% that falls by one percentage point becomes 9%.
Third: a gigawatt is not a gigawatt. The capacity factor is the percentage of the year in which a power station would be producing if it always ran at full power. According to the International Renewable Energy Agency (IRENA), new solar photovoltaic parks averaged 17% in 2024; onshore wind, 34%; offshore wind, 42%. The American nuclear fleet reached 92%, according to the EIA. So 1 GW of solar produces about 1.5 TWh a year, and 1 GW of nuclear produces about 8 TWh: more than five times as much. Comparing installed capacities without the capacity factor is comparing cars by their top speed without asking how many hours they are driven.
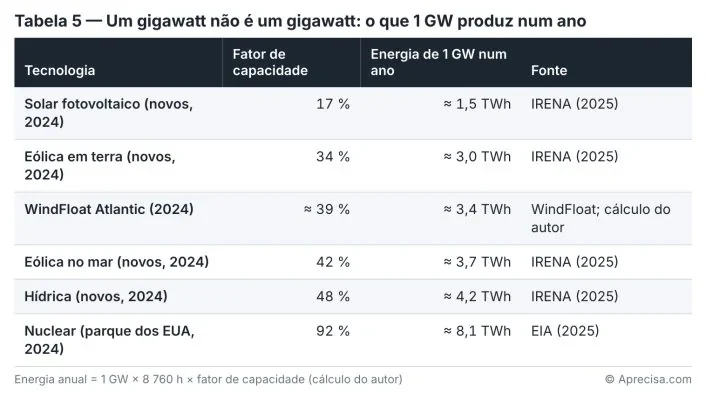
Table 5 converts installed gigawatts into terawatt-hours produced for each technology, using the published capacity factors. It is the table that turns the question “how many GW?” into the right question: “how many TWh?”.
In plain language. “Half the pupils in the class passed” and “half the pupils in the school passed” are similar sentences with very different meanings. Before believing a percentage, always ask: half of what?
VI. The logarithmic ruler in energy
When values span several orders of magnitude, neither the ordinary ruler nor the 0-to-100 ruler will do. This is the territory of the logarithmic ruler, which we explained in “Dez decibéis não são mais dez” (Ten decibels are not ten more): each mark multiplies by ten, and the same distance is always the same number of times.
Emissions. The life-cycle assessment of the United Nations Economic Commission for Europe (UNECE, 2022) gives, in grams of CO₂ equivalent per kWh: nuclear 5.1 to 6.4; onshore wind 7.8 to 16; offshore wind 12 to 23; solar photovoltaic 8 to 83; combined-cycle gas 403 to 513; coal 751 to 1,095. On an ordinary ruler, the first four stick to zero; on a logarithmic ruler, you can see that gas emits about fifty to a hundred times more than wind and that coal is higher still.
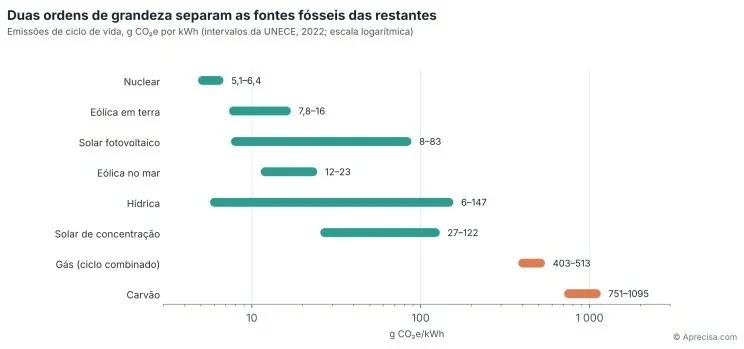
Figure 3 draws each UNECE emissions range as a horizontal bar on a logarithmic ruler. The bars on the left — nuclear, wind, solar, hydro — lie between units and tens of grams per kWh; those on the right — gas and coal — lie between hundreds and a thousand. The message is the distance between the two groups: two orders of magnitude. The width of each bar also teaches something: solar and hydro vary a great deal with location and manufacture; nuclear varies little.
Costs that learn. The price of solar modules fell from about 106 dollars per watt in 1976 to about 0.38 dollars, a fall of 99.6%, with a learning rate of about 20% for each doubling of cumulative production, according to Max Roser (Our World in Data). On an ordinary chart, it is a cliff; on a chart that is logarithmic on both axes, it is a straight line. Way and colleagues (2022) showed that energy models systematically got these forecasts wrong because they did not take the straight line seriously.
Reliability. The “nines” of availability are a logarithmic ruler in disguise. A grid that is available 99% of the time fails for about 88 hours a year; 99.9%, about 8.8 hours; 99.99%, about 53 minutes; 99.999%, about 5 minutes. Each extra nine divides the failure time by ten. Operators measure it with the SAIDI index, defined in the IEEE 1366 standard: the average interruption time per customer per year.
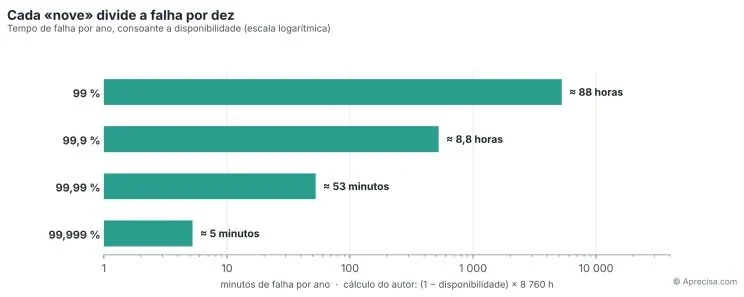
Figure 4 shows the failure time per year for four levels of availability, on a logarithmic ruler. The numbers on the left look almost the same — 99%, 99.9%, 99.99%, 99.999% — but the failure times drop from days to minutes. It is the textbook case of a 0-to-100 scale that, near the top, has to be read as logarithmic: the difference between 99.9% and 99.99% is not “0.09 points”, it is ten times fewer failures.
VII. Other energy rulers
There are also less well-known rulers, but they are indispensable for comparing things of different sizes.
Per unit. Power-system engineers express voltages and currents relative to a reference value, the so-called “per unit” system (p.u.), described in classic textbooks such as Grainger and Stevenson’s. A voltage of 1.05 p.u. is 5% above nominal, whether on a 400 kV line or a 15 kV one. It is the ruler that makes it possible to compare the behaviour of an extra-high-voltage grid with that of a distribution grid.
Per person per day. This is MacKay’s ruler, which we saw in chapter III. It turns national terawatt-hours into personal kilowatt-hours and makes choices comparable.
Per area. Vaclav Smil (2015) called it power density: watts per square metre. According to Vettese’s (2015) review of his book, solar and wind are around 5 W/m², hydro and nuclear 200 W/m², and coal and oil extraction between 1,000 and 10,000 W/m². Three orders of magnitude that explain why the debate about land use does not go away.
Per unit of output. Carbon intensity, in grams of CO₂ per kWh, and energy intensity, in kWh per euro of GDP, make it possible to compare countries and technologies of very different sizes.
Base-100 indices. When you want to compare the evolution of prices or consumption that start from different levels, you set one year equal to 100 and follow the changes. It is a ratio ruler: 120 is 20% above the base year, whatever the absolute value.
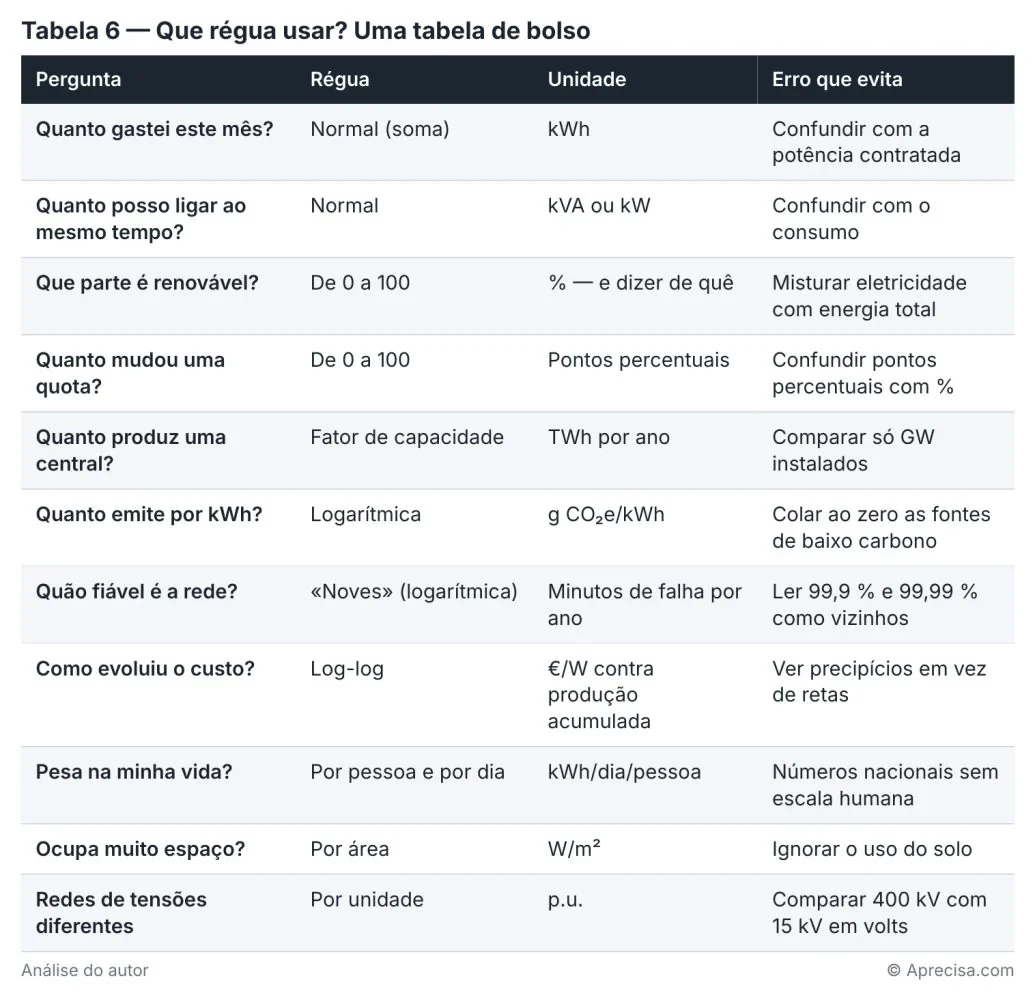
Table 6 is this article’s pocket table: for each typical question about energy, it gives the ruler to use, the unit and the error avoided. It is the table to keep to hand before any debate.
VIII. Four practical cases
Because the wrong ruler, when it turns up, turns up on the bill, in the newspaper, in the garage and in big projects.
Case 1 — The bill. The Energy Services Regulatory Authority (ERSE) uses two reference households: a couple without children, with 3.45 kVA and 1,900 kWh a year, and a couple with two children, with 6.9 kVA and 5,000 kWh a year. The most common contracted power in Portugal is not 6.9 kVA: in 2019, according to ERSE, it was 3.45 kVA, for about 45% of consumers. The bands go up in steps — 1.15, 2.3, 3.45, 4.6, 5.75, 6.9, 10.35 kVA. The granddaughter’s 420 kWh are the month’s consumption; the 6.9 kVA are the circuit breaker’s ceiling. A home with the average Portuguese consumption, about 3,360 kWh a year according to the 2020 INE survey, has an average power of only 0.38 kW — twenty times less than the 6.9 kVA limit. What you pay for in contracted power is not the average consumption: it is the possibility of switching on the oven, the washing machine and the kettle at the same time.
Case 2 — “One wind turbine can power a city”. WindFloat Atlantic produced 86 GWh in 2024 with three turbines and 25 MW: a capacity factor of about 39%. Divided by the average consumption of a home, about 3,360 kWh, that gives about 25,600 homes — the operator speaks of 25,000. Each turbine therefore supplies about 8,500 homes: a small town, not a city. And it supplies them on average, over the year, not every hour: in the hours without wind, the town needs another source. The uncle had the order of magnitude wrong and had forgotten the ruler of time.
Case 3 — The car and the house. The Volkswagen ID.3 battery has 58 kWh usable; the Renault 5 E-Tech’s, 40 or 52 kWh. A home with the average Portuguese consumption uses about 9.2 kWh a day; ERSE’s reference household with two children, about 13.7. The 58 kWh battery is therefore enough for four to six days, not for a month — the cousin was out by a factor of five to seven. Climbing the ladder: the Tâmega complex, Iberdrola’s “gigabattery”, stores about 40 GWh, the equivalent of about 690,000 batteries of 58 kWh — and, even so, only about 6.6 hours of Portugal’s average consumption. It is the best example that “big” depends on the ruler: enormous for a garage, modest for a country.
Case 4 — The data centres. According to the International Energy Agency, the world’s data centres consumed about 415 TWh in 2024, about 1.5% of the world’s electricity, and could reach about 945 TWh in 2030. That is about eight times Portugal’s consumption today, and almost eighteen times in 2030. The Start Campus site in Sines announces 1.2 GW of computing capacity in the long run; the first building has 14 MW, growing to 26 MW. If the 1.2 GW ran at full load all year, they would consume about 10.5 TWh — close to 20% of Portugal’s electricity in 2025, not “more than the country”. The father was right about the direction and out by a factor of five on the size. It is a difference that matters for planning the grid, but it justifies neither panic nor indifference.
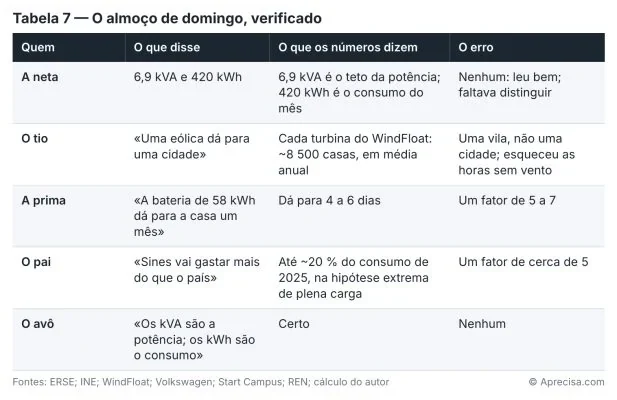
Table 7 brings together the four claims made at the table, the checked number and the error factor. None was completely wrong; all were wrong on the ruler.
IX. Sunday lunch, revisited
I go back to the table, because the grandfather deserves the last word — he was more right than he seemed.
“The kVA are the power; the kWh are the consumption.” The electrician’s sentence is the principle of everything. Anyone who tells the rate from the quantity no longer confuses a turbine with a city, or a battery with a month. Anyone who climbs the ladder of thousands without skipping steps no longer confuses Sines with the country. Anyone who asks “a percentage of what?” no longer confuses 68% with 36.5%. And anyone who knows the logarithmic ruler no longer reads 99.9% and 99.99% as neighbouring numbers.
The granddaughter in the 9th year of school, in fact, has everything she needs: powers of ten, scientific notation, the rule of three and percentages. All she lacks is one question, which applies to any number about energy, and which should be asked in this order:
1. What is the unit — a rate or a quantity?
2. Which step of the ladder are we on — kilo, mega, giga, tera?
3. Which ruler are we using — ordinary, 0 to 100, logarithmic, per person?
First the unit, then the scale, only then the number.
Fewer loose numbers. More right rulers.
In plain language. Nobody measures a fever with a tape measure or the height of a door with a thermometer. Energy also has its instruments: the ordinary ruler for adding up, the 0-to-100 ruler for sharing out, the logarithmic ruler for multiplying. Choosing the right ruler is half the answer.
Gaspar do Amaral
Annotated references
A. In the same series
- Amaral, G. (15/07/2026), O polvo não dispensa a química — sobre a realidade dos números imaginários, LinkedIn
- Amaral, G. (10/2026), Dez decibéis não são mais dez — sobre a escala logarítmica, LinkedIn
- Amaral, G. (10/2026), O barril de 200 quilos, LinkedIn — waste per GWh on a logarithmic ruler.
- Amaral, G. (10/2026), Duas horas ao fim da tarde, LinkedIn — adequacy of the Iberian electricity system.
B. Scientific and institutional literature
- Stevens, S. S. (1946), On the theory of scales of measurement, Science 103(2684) — nominal, ordinal, interval and ratio scales.
- BIPM (2019), The International System of Units (SI), 9.ª ed. — units and prefixes.
- CGPM (2022), Resolução 3 — extensão dos prefixos SI — ronna, quetta, ronto, quecto.
- MacKay, D. J. C. (2009), Sustainable Energy — without the hot air, UIT Cambridge — the kWh per day per person; a 40 W bulb = 1 kWh/day; typical driver ≈ 40 kWh/day.
- MacKay, D. J. C. (2010), Sustainable energy, Engineering & Science (Caltech) — about 125 kWh/day per person in Europe.
- Smil, V. (2015), Power Density, MIT Press — power density in W/m².
- Vettese, T. (2015), recensão de Power Density, Electronic Green Journal 39 — solar and wind ≈ 5 W/m²; hydro and nuclear ≈ 200 W/m².
- Weinstein, L. e Adam, J. (2008), Guesstimation, Princeton University Press — estimates to the order of magnitude.
- Swartz, C. (2003), Back-of-the-Envelope Physics, Johns Hopkins University Press — 104 estimation problems.
- Ärlebäck, J. B. (2009), On the use of realistic Fermi problems…, The Mathematics Enthusiast 6(3) — Fermi problems at school.
- Eames, C. e R. (1977), Powers of Ten; Morrison, P. e P. (1982), livro homónimo — the universe in jumps of ten.
- AIE (2025), Energy and AI — data centres: 415 TWh in 2024; about 945 TWh in 2030.
- INSEE — Tonelada equivalente de petróleo — 1 toe = 41.868 GJ = 11.63 MWh.
- UNECE (2022), Carbon Neutrality in the UNECE Region: Integrated Life-cycle Assessment of Electricity Sources — life-cycle emissions by technology.
- Roser, M. (2020, atualizado em 2025), Why did renewables become so cheap so fast?, Our World in Data — solar modules from 106 to 0.38 $/W; learning rate of 20.2%.
- Way, R., Ives, M., Mealy, P. e Farmer, J. D. (2022), Empirically grounded technology forecasts and the energy transition, Joule 6(9)
- Ueckerdt, F., Hirth, L., Luderer, G. e Edenhofer, O. (2013), System LCOE, Energy 63 — integration costs.
- Hirth, L. (2013), The market value of variable renewables, Energy Economics 38
- Comissão Europeia (2020), New generation EU energy labels — A–G scale since 1 March 2021.
- Regulamento (UE) 2017/1369 — etiquetagem energética
- ENTSO-E (2018), nota explicativa do dimensionamento da reserva de contenção de frequência — reference incident of 3,000 MW in continental Europe (Reg. 2017/1485, Art. 153).
- US DOE/EPA — fueleconomy.gov — 1 gallon of petrol = 33.7 kWh (≈ 8.9 kWh/L).
- Regulamento (UE) 1169/2011, Anexos XIII e XIV — 2,000 kcal = 8,400 kJ; conversion factors.
- IRENA (2025), Renewable Power Generation Costs in 2024 — capacity factors: solar 17%, onshore wind 34%, offshore 42%.
- EIA (11/08/2025), Today in Energy — nuclear capacity factor of 92% in 2024.
- Energy Institute (2026), Statistical Review of World Energy 2026 — solar 8.7% and wind 8.4% of electricity.
- Ember (2026), Global Electricity Review 2026 — 31,779 TWh in 2025.
- ONS — Percentages and percentage points — definition of a percentage point.
- Grainger, J. e Stevenson, W. (1994), Power System Analysis, McGraw-Hill — the per-unit system.
- IEEE Std 1366-2022 — índices de fiabilidade da distribuição — SAIDI.
- data.europa.eu (2023), Data Visualisation Guide — when to use logarithmic axes.
C. Portuguese data and news
- REN (01/01/2026) — Consumo de energia elétrica atinge valor mais elevado de sempre em 2025 — 53.1 TWh; 68% renewable.
- REN — Dados Técnicos 2025 — installed capacity and peaks.
- REN (06/01/2025) — 2024: 51,4 TWh, 71 % renovável
- REN (07/01/2026) — Consumo ultrapassa pela primeira vez os 10 GW — 10,168 MW.
- APREN (06/01/2026) — Análise de 2025 — 75.6% of production; −4.9 p.p.
- DGEG (31/10/2025) — Balanço Energético Nacional 2024 — 36.5% renewable in gross final energy.
- Eurostat (23/07/2026) — Renováveis: 26 % da energia da UE
- ERSE (15/09/2026) — Atualização da tarifa de energia — reference households: 3.45 kVA/1,900 kWh and 6.9 kVA/5,000 kWh.
- Dinheiro Vivo (29/05/2019) — ERSE: potência contratada — 3.45 kVA for about 45% of consumers.
- ERSE — Manual do simulador de potência contratada — power bands.
- Polígrafo (28/09/2022) — Consumo médio das famílias (INE, 2020) — about 3,360 kWh/year.
- WindFloat Atlantic — Cinco anos de operação — 25 MW; 86 GWh in 2024.
- Iberdrola — Gigabateria do Tâmega — 1,158 MW; 40 GWh of storage.
- Alstom (23/01/2013) — Alqueva II — 520 MW reversible.
- Neoen (05/06/2025) — Maior parque solar de Portugal — 272 MWp.
- EDP (14/07/2020) — Encerramento das centrais a carvão — Sines, 1,180 MW.
- EDF (14/12/2025) — Flamanville EPR a 100 % — 1,669 MW gross electrical.
- El Independiente (28/04/2025) — Perda súbita de 15 GW
- ERSE (14/01/2026) — Audição parlamentar sobre o apagão — 4,271 MW of automatic load shedding in Portugal.
- Volkswagen — ID.3: bateria e carregamento — 58 and 77 kWh usable.
- Renault — R5 E-Tech — 40 and 52 kWh.
- AIE (10/04/2025) — Procura de eletricidade dos centros de dados
- Start Campus (08/08/2024) — Sines: 1,2 GW de capacidade informática
- Euronews/INE (22/06/2026) — População residente: 11,4 milhões
- RTP/Lusa (13/04/2026) — Renováveis asseguram 78,5 % no 1.º trimestre — 571 hours at 100% renewable.
- NEA (2022) — Consumo de energia em casa — typical power ratings of household appliances.
Illustrations and tables: © Aprecisa.com, AI-assisted.
Gaspar do Amaral
Methodological note
Everything in this essay that is not published data, but a calculation, classification or construction by the author, is identified below.
1. Kettle and bulb. 2,500 W × 0.1 h = 250 Wh; 8 W × 10 h = 80 Wh. Typical powers according to the NEA (2022): kettle 2,500 to 3,000 W; LED 6 to 10 W. Ratio of powers 2,500 ÷ 8 ≈ 310; ratio of energies 250 ÷ 80 ≈ 3.
2. Average power of Portugal. 53.1 TWh ÷ 8,760 h ≈ 6.06 GW (REN, 2025).
3. Fermi, turbines. WindFloat Atlantic: 86 GWh ÷ 3 turbines ≈ 28.7 GWh per turbine; ÷ 8,760 h ≈ 3.27 MW average. 6,060 MW ÷ 3.27 MW ≈ 1,850 turbines. Ignores the variability of the wind and losses.
4. kWh per day per person. 53.1 × 10⁹ kWh ÷ 11,424,031 residents (INE, 31/12/2025) ÷ 365 ≈ 12.7 kWh/day. Food: 2,000 kcal × 4.184 kJ/kcal ÷ 3,600 kJ/kWh ≈ 2.32 kWh/day. Ratio ≈ 5.5. The sum uses the country’s total electricity (including industry and services), not just household use.
5. Carnot. η = 1 − T(cold) / T(hot). In kelvin: 1 − 303.15/873.15 ≈ 0.65. In degrees Celsius (wrong): 1 − 30/600 = 0.95. Illustrative temperatures.
6. Percentage points. 80.5% − 75.6% = 4.9 p.p. (APREN, 2025); 4.9 ÷ 80.5 ≈ 6.1% relative fall.
7. Capacity factor. Annual energy = power × 8,760 h × factor. 1 GW × 8,760 h × 0.17 ≈ 1.49 TWh; × 0.92 ≈ 8.06 TWh; ratio ≈ 5.4.
8. Nines. Failure time = (1 − availability) × 8,760 h: 99% → 87.6 h; 99.9% → 8.76 h; 99.99% → 52.6 min; 99.999% → 5.3 min.
9. World. 31,779 TWh (Ember, 2025) ÷ 8,760 h ≈ 3.63 TW. Data centres: 415 TWh ÷ 8,760 h ≈ 47 GW; 415 ÷ 51.4 TWh (Portugal 2024) ≈ 8.1; 945 ÷ 53.1 ≈ 17.8.
10. Home and average power. 3,360 kWh ÷ 8,760 h ≈ 0.38 kW (INE, 2020, via Polígrafo); 6.9 ÷ 0.38 ≈ 18, “about twenty times”.
11. WindFloat. 86 GWh ÷ (25 MW × 8,760 h) ≈ 39%; 86 × 10⁶ kWh ÷ 3,360 kWh ≈ 25,600 homes; ÷ 3 ≈ 8,500 per turbine.
12. Car and home. 3,360 ÷ 365 ≈ 9.2 kWh/day; 5,000 ÷ 365 ≈ 13.7 kWh/day; 58 ÷ 13.7 ≈ 4.2 days; 58 ÷ 9.2 ≈ 6.3 days. Tâmega: 40 GWh ÷ 58 kWh ≈ 690,000 batteries; 40 GWh ÷ (53.1 TWh ÷ 365) × 24 h ≈ 6.6 h. The cousin’s sentence (“a month”) is illustrative fiction.
13. Start Campus. 1.2 GW × 8,760 h ≈ 10.5 TWh; ÷ 53.1 TWh ≈ 20%. Extreme assumption of continuous full load of the announced computing capacity, without cooling; it is not a forecast.
14. Blackout. 15 GW (statement by the Spanish Government) ÷ 10.168 GW (Portuguese peak, REN) ≈ 1.5.
15. Figures. Figures 1, 2 and 4 are constructions by the author with the values above; Figure 3 reproduces the ranges published by UNECE (2022). The characters’ lines in the opening scene are illustrative fiction.
About this translation. A translation of the article the author published on LinkedIn on 10 October 2026; the full Portuguese version is on this site. The twelve original images (formulas, Tables 1 to 7 and Figures 1 to 4) are reproduced with their texts in Portuguese and a translated caption. Titles of sources stay as in the original; the links are those of the original.
The discussion is on LinkedIn (in Portuguese)
Comments on this text are made on LinkedIn, where the article was shared in Portuguese. You are welcome to write in English. Agree, disagree or add data: every well-founded objection receives a reply.
Gaspar do Amaral · Original in Portuguese of 10 October 2026, published on this site; translation issued on 27 October 2026 · Figures and tables © Aprecisa.com · AI-assisted