 ← Grupo Aprecisa · Connecting those who know with those who need
Resilience · Newsletter “A Porta Estreita” (The Narrow Door)
Day 211: the narrow door our resilience passes through
“A Porta Estreita” (The Narrow Door), episode 1: the Strait of Hormuz and the resilience of States, companies and families
Gaspar do Amaral · 27 September 2026
Translated from the Portuguese original. This version was issued on 27 October 2026.
On this site, this article has been
What the crisis in the Strait of Hormuz teaches about the ability of a State — and of a home — to withstand a shock. Six ideas, six everyday examples, zero political opinions.
On 20 September 2026, through a water corridor where an average of 85 ships a day used to pass, one passed.
Just one.
That corridor is the Strait of Hormuz, the exit door of the Persian Gulf. In 2025 about 20 million barrels of oil a day passed through it, about a quarter of all the oil carried by sea. Liquefied natural gas (LNG) also passed through it, and about a third of the fertilisers carried by sea in the world.
Since 28 February 2026, that door has been practically closed. Today, 27 September, is day 211.
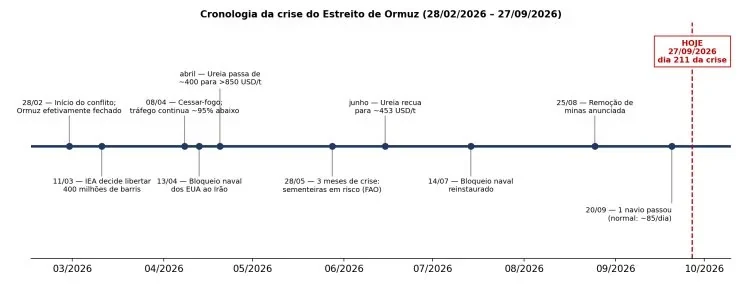
It was not one shock. It was several at the same time — and they all passed through the same door.
I am not going to discuss who is right in the conflict. I propose to use the crisis as a live engineering lesson, to answer a question that any State, company or family should be able to answer: if the door closes tomorrow, how long can we hold out?
1. When bad luck comes in pairs
If two risks each have a 10% probability and are independent, the chance of them happening together is 1%. Emergency plans usually rest on this calculation. But it fails when there is a common cause.
In everyday life: the mobile phone and the Wi-Fi rarely break down on the same day, until the day the power goes off. On a strike day, the bus does not come, nor does the train, and ride-hailing trips (platforms such as Uber or Bolt) shoot up in price because everyone books them at the same time. Three alternatives, a single cause.
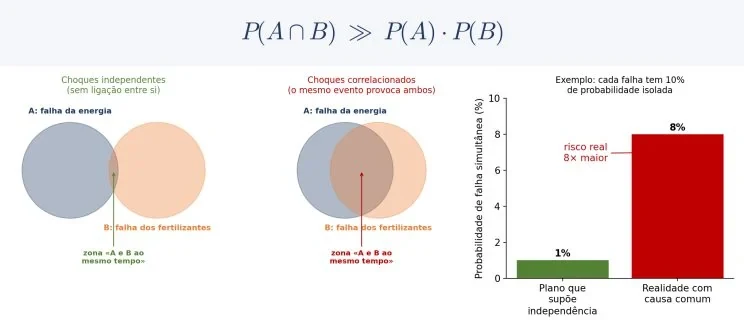
In 2026: on 28 February, a single event hit oil, gas and fertilisers on the same day. The International Energy Agency (IEA) recorded that exports through the strait fell to less than 10% of their previous level.
Planning for risks one at a time is planning for a world that does not exist.
2. The domino effect
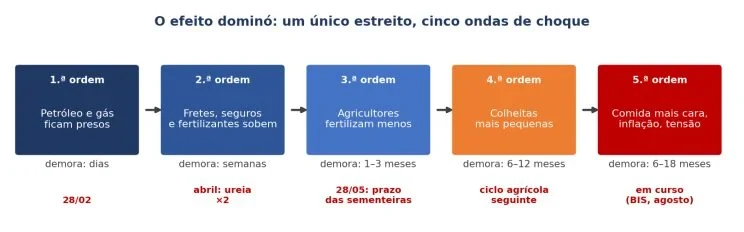
Oil goes up within days, and everyone sees it. What few people follow is the rest of the chain:
- 1. Natural gas is the raw material of nitrogen fertilisers.
- 2. With fertiliser dearer, farmers use less.
- 3. Less fertiliser gives smaller harvests months later.
- 4. Smaller harvests give dearer food.
In everyday life: the alarm clock does not go off, you miss the bus, you arrive late for the test, you have to study at the weekend and you miss Saturday’s match. The last effect appears five days later, in a place that no longer seems to have anything to do with the alarm clock.
In 2026:
- March: the Food and Agriculture Organization of the United Nations (FAO) warned that a disruption of more than three months would affect the 2026 sowing. That deadline ran out on 28 May.
- April: urea, the most widely used nitrogen fertiliser in the world, went from about 400 to more than 850 dollars per tonne, according to the World Trade Organization (WTO).
- August: the Bank for International Settlements (BIS) identified the disruption as a worldwide force for stagflation, that is, a stagnant economy with rising prices.
Fertiliser that arrives after the sowing does not recover the harvest.
3. The illusion of having two
Engineers protect critical systems with redundancy: if one part fails, another takes over. But if the two share a single point of failure (SPOF), having two is the same as having one.
In everyday life: setting two alarms for an exam, both on the same mobile phone. If the battery runs out during the night, neither goes off.
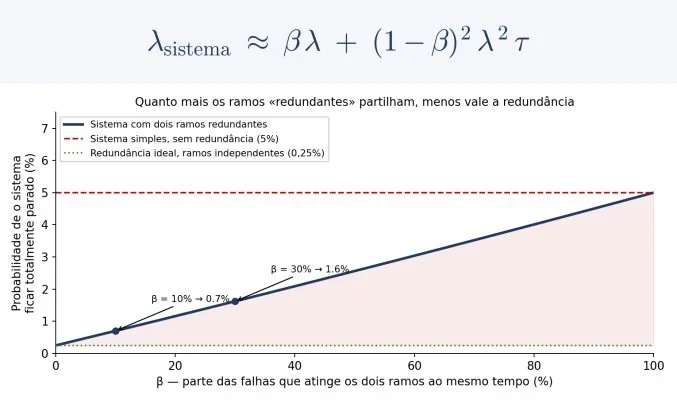
The letter β measures the share of failures that hits both branches at the same time. The calculation follows the IEC 61508 standard of the International Electrotechnical Commission.
In 2026: the pipelines that bypass the strait add up to about 8.8 million barrels a day, against about 20 million that used to pass through it. For the Gulf’s fertilisers there was no bypass at all: all the “different suppliers” depended on the same door.
Two roads that pass through the same door are a single road.
4. Resilience is not never falling
All systems fall when the shock is strong enough. Resilience measures how much is lost until you are back on your feet: the depth of the fall added to the recovery time. In the graph, it is the shaded area.
In everyday life: two homes lose their internet. In one it comes back after five days; in the other it becomes slow, but the next day it is normal. The problem was the same; the loss was not.
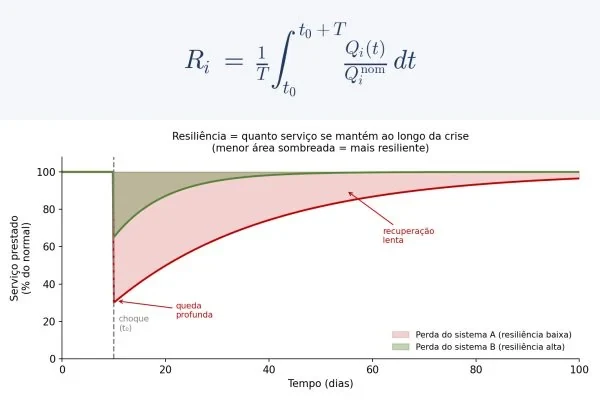
In 2026: according to PortWatch, the platform of the International Monetary Fund (IMF) and the University of Oxford that tracks ships by satellite, 6 ships passed on 6 September, 8 on the 13th and 1 on the 20th. The ceasefire of 8 April did not make the curve rise: two days later, traffic was still about 95% below normal. But PortWatch only counts ships with their AIS, the automatic identification system, switched on. Windward, which cross-checks satellite and other sources, counted 24 transits on 27 September — 14 of them by ships running “dark”. Even so, that is less than a third of normal traffic.
(Updated on 29/09/2026: Windward’s count, which includes ships without AIS, was added.)
5. How many days does what we have last?
Autonomy is the stock divided by what is effectively lost per day, that is, consumption minus what can still come in by other routes.
In everyday life: €60 of pocket money, spending €4 a day on snacks, lasts 15 days. If grandma gives €1 a day, it lasts 20. If you take sandwiches from home, it lasts 60. The piggy bank did not change; what comes in and what goes out did.
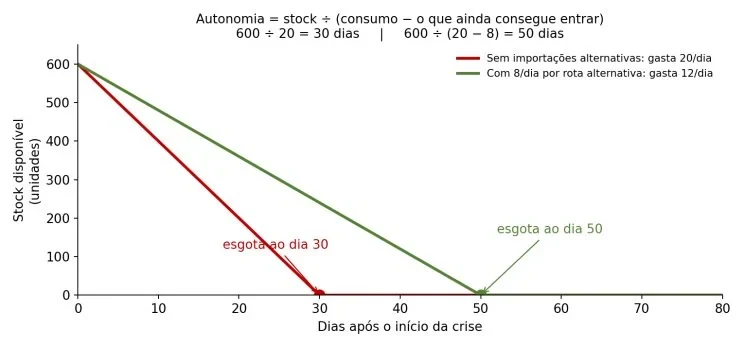
In 2026: on 11 March, the 32 IEA countries decided to release 400 million barrels from their emergency reserves, the largest release in history. It looks like a mountain, but 400 ÷ 20 gives 20 days of full replacement of the lost flow. The crisis is at day 211. (The calculation is simplified: it ignores the increase in production in other regions and the reduction in consumption.)
400 million barrels look like a mountain. They are 20 days.
6. The race against the clock — and the weakest link
The stock has to last longer than the time to decide added to the time for resupply to arrive. The time to decide is the only one that depends entirely on us, and it is almost always the most forgotten.
In everyday life: anyone who only orders gas when the bottle runs out goes two days without hot water. Anyone who has a second bottle and orders at the moment of the swap never runs out.
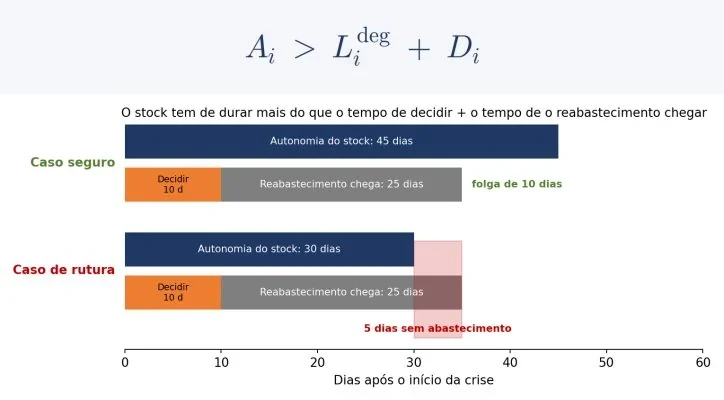
With a limited budget, you choose the plan whose worst result is the least bad, and not the one with the best average. A bicycle with new brakes and a flat tyre does not go.
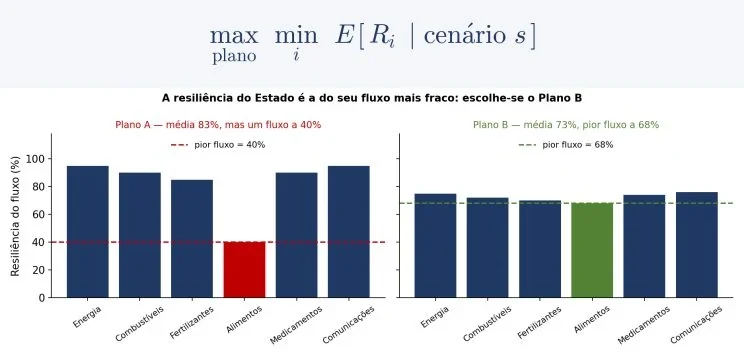
In 2026: oil had a reserve mechanism ready since 1974, and the coordinated decision took 11 days. Fertilisers had nothing equivalent, and that is where the price shot up most. An irony pointed out by the FAO: the Gulf countries themselves import between 70% and 90% of the staple foods they consume, and that food comes in through the same door.
The chain always breaks at the weakest link. Never at the average.
What to do: the data and the solutions already exist
Almost everything that needed to be known was publicly available, often every day:
- Shipping traffic: PortWatch.
- Oil: monthly reports from the IEA.
- Cereals and fertilisers: AMIS, the G20’s Agricultural Market Information System.
- Pass-through to food prices: IFPRI, the International Food Policy Research Institute.
The solutions are also written down:
- The ISO 22301 (business continuity) and ISO 31000 (risk management) standards of the International Organization for Standardization.
- The European CER Directive, on the resilience of critical entities.
- The NIS 2 Directive, on cybersecurity.
- NATO’s national resilience requirements.
In most cases, two things were left undone: bringing everything to the same table and deciding in advance, with rules of the type “if indicator X passes value Y, we do Z”.
Resilience is not bought on the day of the crisis. It is decided long before it.
Six questions to take with you:
- 1. Which of my risks have a common cause?
- 2. What is the fifth wave of the domino in my area?
- 3. Which “plan B” passes through the same door as plan A?
- 4. What costs me more: falling deep or taking long to get up?
- 5. How many days can I hold out, counting the time to decide?
- 6. What is my weakest link, and how much do I invest in it?
Of these six questions, there is one you can answer today, with a sheet of paper and 15 minutes: how many days can I hold out, counting the time to decide?
The following annex shows how, with an example worked out step by step: one family, one power cut, four essential items.
At the end, there is a sheet for doing the same for your home.
The laws that apply to a strait through which 20 million barrels a day used to pass also apply to a pantry.
Annex — How many days can your home hold out?
An example worked out, step by step, and a sheet for doing your own.
Before you start
Remember 28 April 2025
On that day, Portugal and Spain were without electricity for several hours. Perhaps you remember what ran out first in your home: the light, the internet, the mobile phone, the water, the cash machine, the food in the fridge.
A question for you, before reading
If the power cut lasted three days instead of a few hours, what would be the first thing to run out in your home? Keep the answer: at the end you will be able to check it with numbers.
You do not need to know maths. Adding, multiplying and dividing are enough.
The situation
The Martins family (father, mother and two children) lives in a flat. A storm cuts the electricity in the neighbourhood. The pumps that take the water up to the floors are also electric, so the tap water fails at the same time.
This is the common cause from the article: a single event knocks out two services.
Civil protection warns that bottled water and electricity may take a few days to come back. The family sits at the table with a sheet of paper and asks a simple question: how many days can we hold out?
The three numbers you will need
- S = what you have stored. Only what you can really use during the power cut counts.
- C = what you use per day on essentials, already in saving mode.
- I = what keeps coming in per day by another route that still works.
With them you work out how many days you can hold out:
A = S ÷ (C − I)
Step by step: water
1. Choose the item
One at a time.
The family starts with water: without it you cannot last more than a few days.
2. Count what you have (S)
2 large 5 L bottles + 12 bottles of 1.5 L
S = 10 + 18 = 28 litres
3. Work out what you use per day (C)
Civil protection recommendations generally range between 3 and 4 litres per person per day.
The lowest value is used: 3 litres.
C = 4 people × 3 L = 12 litres per day
4. See what keeps coming in (I)
The neighbour has a well, which looks like a solution.
But the well pump is also electric and fails for the same reason.
This is the illusion of having two, and so it does not count.
I = 0 litres per day
5. Work out the autonomy (A)
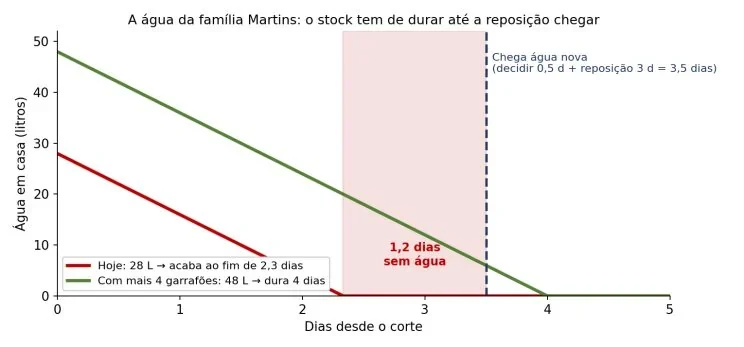
A = 28 ÷ (12 − 0) = 2.3 days
6. Compare with the response time
It is not enough to know how long the water lasts.
You need to know when new water arrives:
- D (decide): the family discusses whether to go out or wait, and loses half a day. D = 0.5 days.
- L (restock in a crisis): the civil protection water arrives after 3 days. L = 3 days.
D + L = 3.5 days
7. Work out the margin
Margin = A − (D + L) = 2.3 − 3.5 = −1.2 days
What the number means
A negative margin is the number of days the family is without that item.
The Martins would be about one day and five hours without water.
The other three items, by the same method
Food
The pantry has food for 5 days.
But the hob is electric: without power, only what can be eaten without cooking counts.
That is enough for 3 days.
The common cause has hidden again where you did not expect it.
A = 3 days · D + L = 3.5 days · Margin = −0.5 days
Mum’s medicine
She has 10 tablets and takes 1 a day.
The pharmacy has a generator, but in a crisis it takes 4 days to restock, and deciding to go there takes 1 day.
A = 10 days · D + L = 5 days · Margin = +5 days
Mobile phone
It is the only channel for asking for help.
It uses 1 charge a day and there are 3 (phone and power bank).
The car allows it to be charged once a day, so what comes in equals what is used.
A = 3 ÷ (1 − 1) → no limit, as long as there is fuel.
The family’s chart
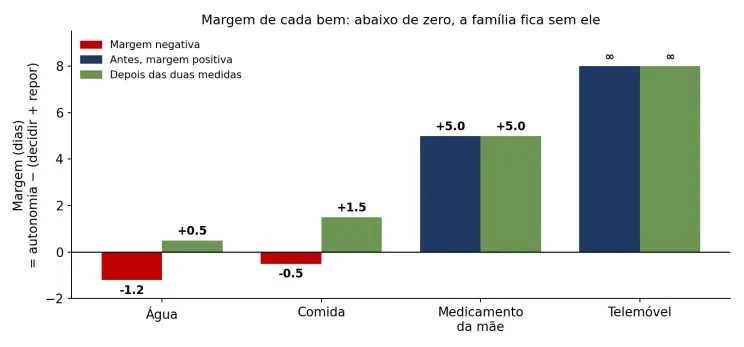
- Water: lasts 2.3 days → margin −1.2
- Food: lasts 3 days → margin −0.5
- Medicine: lasts 10 days → margin +5
- Mobile phone: no limit
The weakest link is water, followed by food. That is where you act first.
What to do: two cheap measures
Measure 1: store more water
4 more large 5 L bottles take the stock to 48 L.
A = 48 ÷ 12 = 4 days → margin +0.5 days.
The family no longer runs out of water.
Measure 2: cut the common cause in food
Instead of more tins, a camping gas stove.
The whole pantry counts again.
A = 5 days → margin +1.5 days.
The most important lesson
The second measure gained more margin than buying more food would have.
Cutting the common cause is often worth more than increasing the stock.
That is what happened in Hormuz: the world was not short of oil; it was short of a road that did not pass through the same door.
Note: the values are illustrative and serve to teach the method. Always follow the recommendations of the civil protection in your area.
Now it is your turn (15 minutes)
For each item (water, food, medicines, mobile phone and energy, cash), write down:
- 1. How much you have → S
- 2. How much you use per day on essentials → C
- 3. How much keeps coming in per day → I
- 4. How many days you can hold out → A = S ÷ (C − I)
- 5. How long it takes to decide and to restock in a crisis → D + L
- 6. The margin → A − (D + L)
Check questions, before trusting the result
- Did I count only what I can use without power, without cold and without leaving home?
- Did I use the minimum consumption, and not the usual one?
- Does the alternative work without electricity, internet and cash machines? If not, I = 0.
- Did I use the restocking time in a crisis, and not the normal one?
- Do I know who decides at home and what they do, without arguing?
A question for you, after doing the sums
What is your weakest link? Does it confirm the guess you made at the start?
And what is the cheapest measure that puts it above zero?
What to take away from this annex
- One item at a time: what you have, what you use, what comes in.
- Autonomy is not enough: always compare it with deciding + restocking.
- Be wary of alternatives: if they fail for the same reason, they do not count.
- Fix the weakest link first and, whenever you can, cut the common cause.
- Repeat every six months: stocks get used up and go out of date.
A home’s resilience is measured in days.
And it is measured before the crisis.
This is the first episode of the series “A Porta Estreita” (The Narrow Door). In the coming weeks, each idea will have its own article, with a new real case — from submarine cables to the Iberian blackout of 2025:
- 2. When bad luck comes in pairs
- 3. The domino effect
- 4. The illusion of having two
- 5. Resilience is not never falling
- 6. 400 million barrels are 20 days
- 7. The most expensive time is the time to decide
- 8. The weakest link
- 9. The manual
Subscribe to the newsletter to receive each episode on Tuesdays.
References
- IEA (11/03/2026). Press release on the coordinated release of 400 million barrels. https://www.iea.org/news/iea-member-countries-to-carry-out-largest-ever-oil-stock-release-amid-market-disruptions-from-middle-east-conflict/
- BIS (August 2026). Working Paper No. 1378 — Maritime Chokepoints and the Global Economy: Evidence from the Strait of Hormuz. https://www.bis.org/publications/working-paper-1378-maritime-chokepoints-and-global-economy-evidence-strait-hormuz.pdf
- WTO (10/07/2026). Data Blog — fertiliser trade affected by the conflict. https://www.wto.org/english/blogs_e/data_blog_e/blog_dta_10jul26_451_e.htm
- FAO (2026). Warning from the Chief Economist on food security. https://www.fao.org/newsroom/detail/fao-chief-economist-warns-of-severe-global-food-security-risks-from-disruption-to-strait-of-hormuz-trade-corridor/en
- FAO (2026). Statement by the Director-General on the Hormuz crisis. https://www.fao.org/newsroom/detail/strait-of-hormuz-crisis--fao-director-general-outlines-risks--actions-and-policy-responses/en
- IFPRI (2026). Iran war: From fertilizer to food crisis? https://www.ifpri.org/blog/iran-war-from-fertilizer-to-food-crisis/
- IFPRI / Food Security Portal (2026). How fertilizer policies could exacerbate Hormuz price shocks. https://www.foodsecurityportal.org/node/3890
- AMIS (2026). Market monitor — fertilisers. https://www.amis-outlook.org/list-details/news/p1rk6t4x98quemxoo6tnv9ad
- IMF PortWatch. Traffic data for maritime straits and warning about the limitations of AIS data in the Strait of Hormuz. https://portwatch.imf.org/pages/faqs · https://portwatch.imf.org/pages/chokepoint6
- Straits.live (consulted on 27/09/2026). Daily monitor of the Strait of Hormuz, based on PortWatch data. https://straits.live/
- Windward — Daily Intelligence Highlights (28/09/2026). Hormuz transits on 27/09/2026, including ships without AIS. https://insights.windward.ai/
- News on Air (10/04/2026). Traffic in Hormuz during the ceasefire. https://www.newsonair.gov.in/maritime-traffic-through-strait-of-hormuz-remains-restricted-despite-two-week-ceasefire-between-tehran-washington
- NE Global (03/2026). Capacity of the bypass pipelines. https://www.neglobal.eu/iea-to-carry-out-stock-release-as-middle-east-war-disrupts-markets/
- Directive (EU) 2022/2557 (CER) and Directive (EU) 2022/2555 (NIS 2). https://eur-lex.europa.eu/eli/dir/2022/2557/oj · https://eur-lex.europa.eu/eli/dir/2022/2555/oj
- NATO. Resilience, civil preparedness and Article 3. https://www.nato.int/cps/en/natohq/topics_132722.htm
- Bruneau, M. et al. (2003). A Framework to Quantitatively Assess and Enhance the Seismic Resilience of Communities. Earthquake Spectra, 19(4).
Methodological note
What this page is. A translation of episode 1 of the newsletter “A Porta Estreita” (The Narrow Door), which the author published on LinkedIn on 27 September 2026; the full Portuguese version is on this site.
Figures. The ten figures of the original are reproduced as they are, with their texts in Portuguese; their captions are translated. The paragraph next to each figure explains what it shows. The letters of the formulas (S, C, I, A, D, L) are those of the original and of the figures.
Titles. The titles of sources are kept as in the original; the Portuguese descriptions of the sources are translated. The episodes announced at the end are given with their titles translated.
Changes of form, not of content. The decorative symbols (emoji, coloured squares and dotted lines), the separators and the hashtags of the LinkedIn version were left out; the coloured circles of the family’s chart (red for a negative margin, green for a positive one) are conveyed by the sign of the margin; the numbered steps and lists keep their numbers; the numbered list of references appears as a bulleted list. The links to sources are those of the original.
The discussion is on LinkedIn (in Portuguese)
Comments on this text are made on LinkedIn, where the article was shared in Portuguese. You are welcome to write in English. Agree, disagree or add data: every well-founded objection receives a reply.
Gaspar do Amaral · Original in Portuguese of 27 September 2026, published on this site; translation issued on 27 October 2026 · Figures and tables © Aprecisa.com · AI-assisted