 ← Grupo Aprecisa · Connecting those who know with those who need
Essay · Energy and critical systems
The anaesthetised signal
Why subsidising the price of electricity does not reduce the cost of the power system — from Germany to Texas, from Scotland to Queensland
Gaspar do Amaral · 7 October 2026
Translated from the Portuguese original. This version was issued on 27 October 2026.
On this site, this article has been
The number and what it hides
In 2026, the German State will spend 29.5 billion euros to bring down the price of electricity. The number is true. The way it is usually read is not.
On social media, the headline served as proof of incompetence. In the opposite camp, it served as proof of undisclosed interests. Both readings miss the essential point: the problem is not how much is spent, but where it is spent.
The thesis of this article is simple to state and hard to get round. Subsidising the price does not reduce the cost of the power system. It only changes who pays it and anaesthetises the signal that would force it to be corrected. Germany is not an exception. It is the most visible case of a pattern that repeats itself in every system that has accelerated renewable generation faster than the architecture that should support it.
In plain language. Imagine a main road full of potholes. The State can pay drivers to repair their tyres, or it can fill in the potholes. The first option eases each driver’s expenses this month. The second is the only one that ends the problem. Subsidising the price of electricity is paying for the tyres: the cost is still there, only the payer changes.
Anatomy of a record
About 72% of the amount is not new cost. It is old cost that has changed payer.
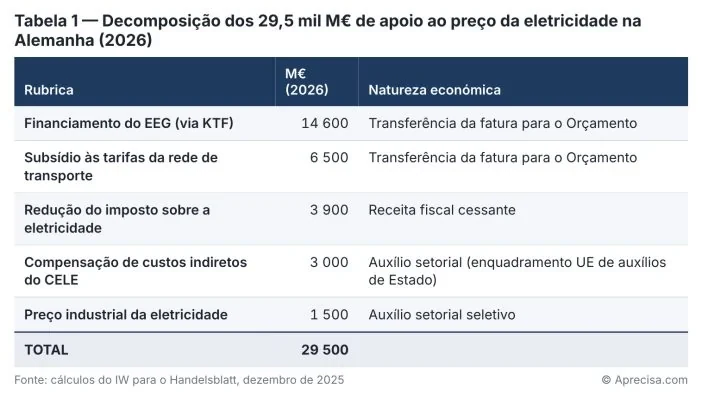
Table 1 shows that the record has two halves of a different nature. The first two rows, €21.1 billion, are charges that have always existed and are no longer on the bill. The rest are aid or forgone tax revenue, and it is these that amount to a new political choice.
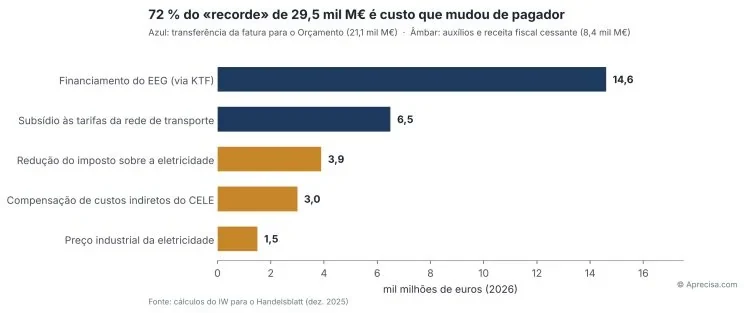
Figure 1 turns the table into immediate evidence: the length of the blue bars is what the headline presents as “record spending” but which, in reality, was already paid by consumers on the bill before 2022. Only the amber bars, about €8.4 billion, represent a genuinely new public effort. That is the proportion the public debate should be discussing.
Until July 2022, the EEG (Germany’s Renewable Energy Sources Act) was financed by a surcharge on the bill. In 2021, it was 6.5 ct/kWh, about €227 a year for a household using 3,500 kWh. The surcharge was abolished and the deficit of the EEG account passed to the Climate and Transformation Fund. In 2025, the Federal Budget transferred about €16.5 billion to that account. The subsidy for transmission tariffs follows the same logic from 2026.
That is why the comparison with the €4.13 billion of 2020 is methodologically weak. In 2020, the more than €20 billion of the EEG was paid on the bill and did not enter the public accounts. What grew explosively was not the cost. It was its visibility in the budget.
In plain language. Imagine that a household’s electricity bill starts being paid with the grandfather’s card instead of the parents’ card. The family does not use less electricity; it has only changed card. Anyone who looks only at the grandfather’s statement sees “record” spending, but the family’s spending is the same. This is what happened in Germany: the renewables share left the bill and moved to taxes.
The countercyclical paradox
The cost of supporting renewables rises when the wholesale price falls. This is the first relationship that any serious reading of the German number must establish.
Under the market-premium scheme, the cost is, to a first approximation, the sum across technologies of the difference between the guaranteed reference value and the market value captured:

where Ei is the supported energy of technology i, AWi the reference value (anzulegender Wert) and MWi the monthly market value of that technology.
Three consequences follow from the expression:
- 1. Inverse correlation with the price. In 2025, a prolonged Dunkelflaute (a period of “dark doldrums”, with little wind and little sun) in the first quarter pushed prices up and reduced payments. The Bund (the federal government) transferred €16.5 billion, less than the €17.2 billion budgeted. The weather became a budget variable.
- 2. Cannibalisation. As the photovoltaic share grows, the captured value MWPV falls faster than the average price, because the whole fleet produces in the same hours (Hirth, 2013). The success of deployment widens the gap that the Budget has to cover.
- 3. Structural mitigating factors. The photovoltaic contracts of 2004 to 2010, with tariffs above 40 ct/kWh, are gradually leaving the system after 20 years. New capacity comes in through auctions, at a fraction of that value, and recent installations are no longer paid in hours of negative prices.
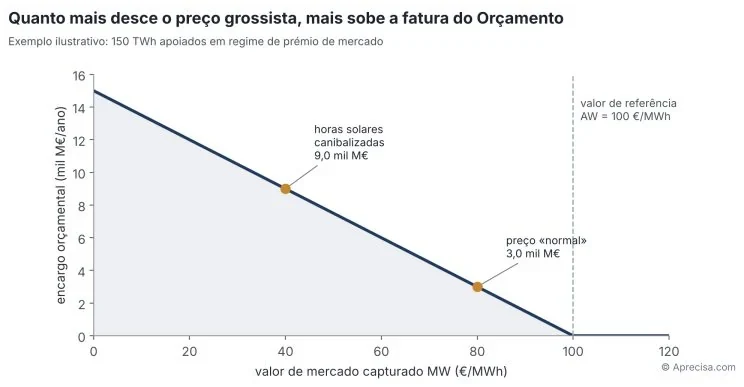
Figure 2 shows the mechanics of the paradox in an illustrative example of 150 TWh supported with a reference value of 100 €/MWh. With a “normal” market price of 80 €/MWh, the Budget pays €3 billion. If solar cannibalisation pushes the captured value down to 40 €/MWh, the public bill triples to €9 billion without a single additional panel being installed. The line falls from left to right: every euro the market stops paying is a euro the taxpayer starts paying.
The result is public spending indexed to a variable that energy policy itself pushes down. This is not a cyclical risk. It is a design risk.
In plain language. Imagine that the State guarantees a farmer 1 euro per kilo of tomatoes. If the market pays €0.90, the State pays €0.10. If the market pays only €0.30, the State pays €0.70. When all the farmers harvest in the same week, the price falls and the State’s bill rises. The same happens with the sun: all the panels produce at midday, the price for that hour falls, and the more panels there are, the bigger the gap the Budget has to pay. It is like selling ice creams on a beach where all the sellers open at the same time.
Cost of the technology, cost of the system
The LCOE (levelised cost of electricity) measures how much it costs to produce one MWh at the connection point. It does not measure how much it costs to deliver it, at the right moment, with frequency and voltage within limits. The metric that answers that second question is the System LCOE (Ueckerdt et al., 2013):

The integration terms grow non-linearly with the share of variable renewables, as the NEA/OECD quantified in its 2019 study on system costs. That is why the LCOE of a solar park can fall every year while the cost of the delivered kWh rises.
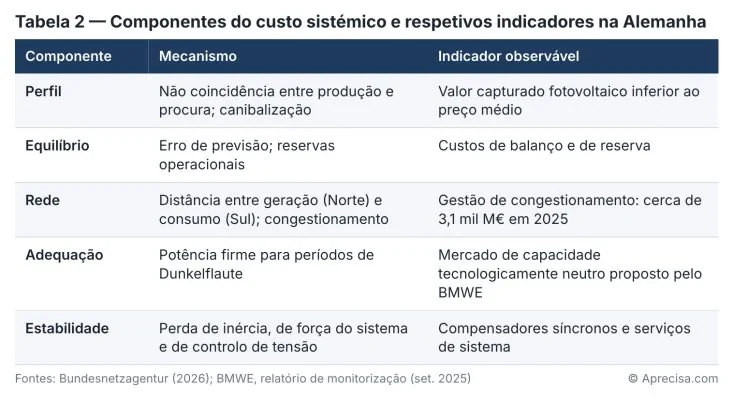
Table 2 translates the equation into operational reality: each term has a bill of its own, and none of them appears in the LCOE. In 2025, 60% of the volume of generation curtailed because of congestion came from renewable installations, and photovoltaic redispatch almost doubled compared with 2024.
The German Ministry itself has adopted this framework. The monitoring report of September 2025, prepared by EWI and BET, defines system cost as the sum of generation, grids, storage and security of supply. But, in the same budget cycle, the Government spent more on masking the price than on reducing those terms.
In plain language. A low-cost flight advertised at 19 euros rarely costs 19 euros. There is the suitcase, the choice of seat and the coach to an airport 80 km from the city. The LCOE is the price of the ticket; the cost of the system is the price of the journey. A solar park can produce very cheap electricity in the Alentejo (in southern Portugal). But if that electricity has to travel to Lisbon along a line that does not yet exist, needs a battery to reach the night and another power station for the days without sun, all of that is part of the price of the journey.
The same pattern, in five systems
None of the large power systems with high renewable penetration has escaped the problem. What sets them apart is whether they made it visible in the price or hid it in the Budget.
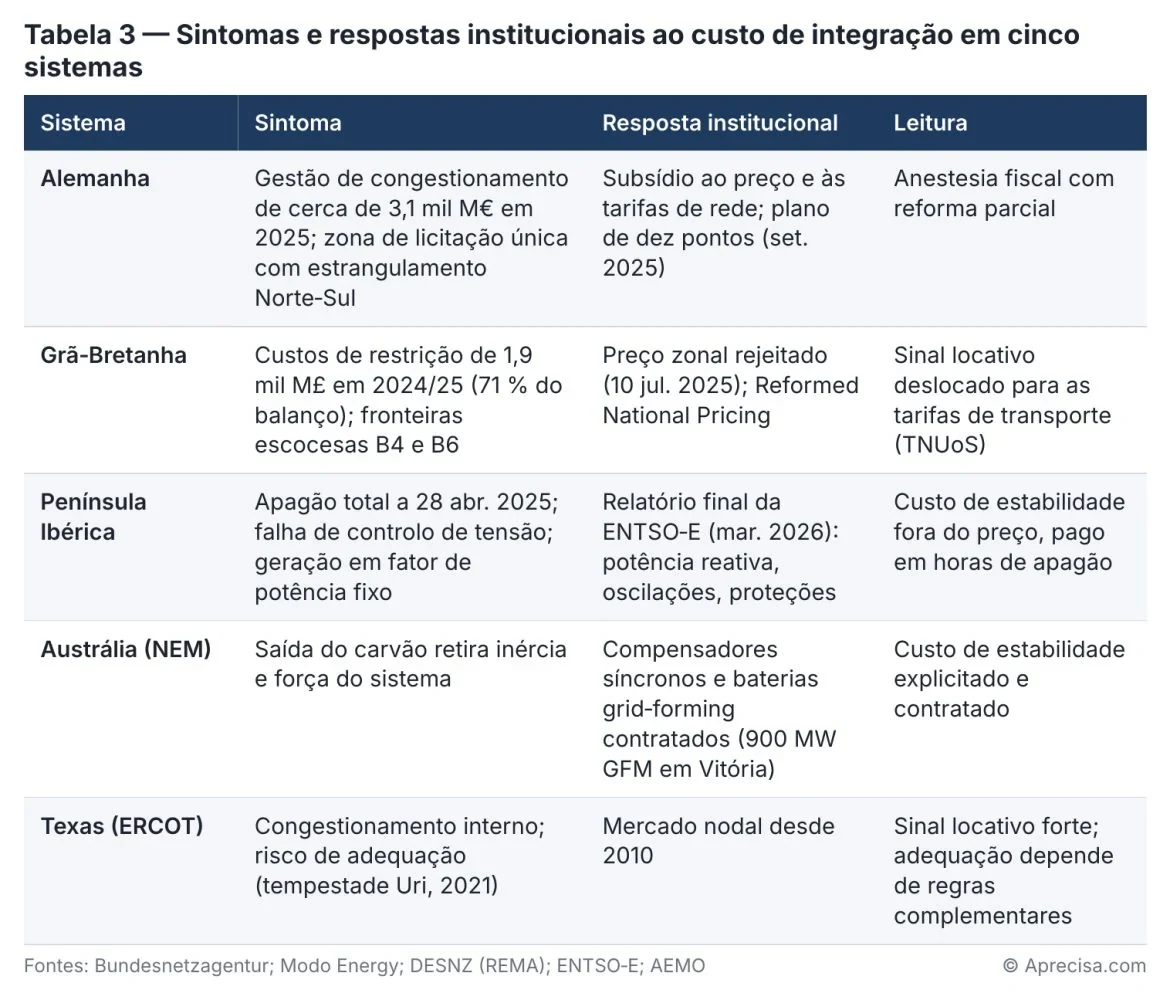
Table 3 ranks the systems by how explicit the system cost is. In Germany, the cost is absorbed by the Budget. In Great Britain, it is moved to another item on the bill. In Iberia, it was paid in blackout. In Australia and Texas, it is named and paid by whoever causes it or whoever solves it. Only in these last two do the economic signal and physics speak the same language.
Great Britain deserves a note. The Government acknowledged that zonal reform would bring efficiency gains, but rejected it because of the implementation period, of at least seven years, and the risk to investors. Constraint costs may reach £4 to 8 billion a year by 2030 without deep intervention. It is the same choice as Germany’s: institutional stability today, system cost tomorrow.
In plain language. Imagine a country where parking costs the same everywhere: in central Lisbon at rush hour and in an inland village at three in the morning. Nobody has a reason to leave the car outside the centre, and the centre gets jammed. A single price zone does the same with electricity: the producer is paid the same whether the grid has spare room where it is or is congested. Texas’s nodal price works like a parking meter that goes up when the street fills. The British preferred to keep the price the same and charge the difference on another line of the bill.
The physics that cannot be subsidised
A subsidy can lower the price of one MWh. It cannot add a single second of inertia to a grid.
In the instant following the loss of a large unit, the rate of change of frequency is determined solely by the kinetic energy stored in the synchronous rotating masses:
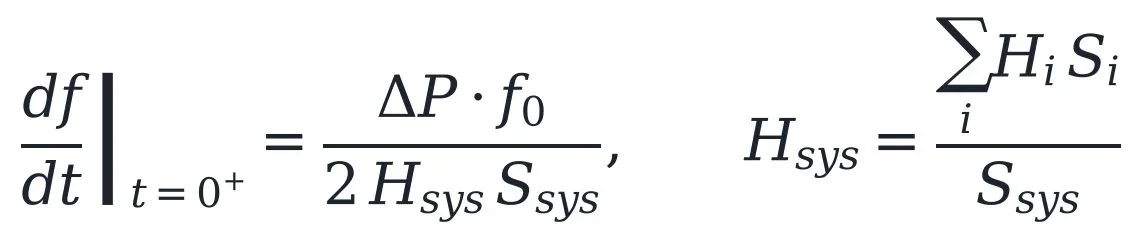
where ΔP is the power imbalance, f0 the nominal frequency (50 Hz), Hi the inertia constant of each machine and Si its apparent power. Conventional inverters, in grid-following mode, contribute Hi = 0. Every synchronous MW replaced by a MW of conventional inverter reduces Hsys and increases the RoCoF for the same incident.
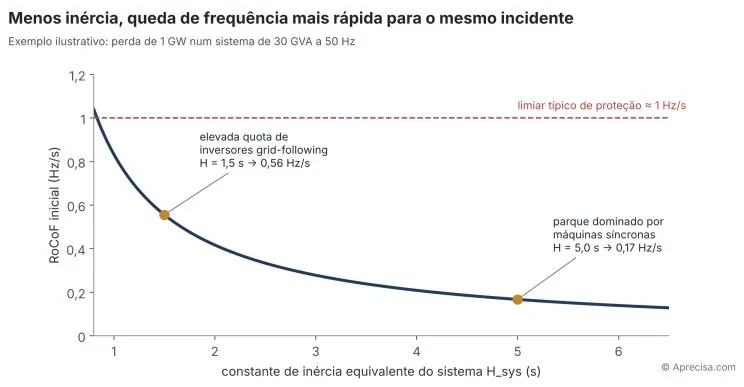
Figure 3 applies the equation to an illustrative 30 GVA system that loses 1 GW. With a fleet dominated by synchronous machines (H ≈ 5 s), the frequency falls at 0.17 Hz/s and operators have time to react. With a high share of conventional inverters (H ≈ 1.5 s), the fall is more than three times faster, and the system approaches the threshold at which protections begin to disconnect equipment. The curve is hyperbolic: the last reductions in inertia are the most dangerous.
The same holds for system strength (short-circuit power) and for voltage control. The Iberian lesson is unequivocal: the blackout did not result from an excess of renewables, but from insufficient reactive power and voltage control that did not work as it should. Most renewable installations were operating at a fixed power factor, without contributing to regulation.
For decades, these services were a free by-product of thermal and hydro generation. Today they have to be specified and bought:
- Connection standards: Regulation (EU) 2016/631 (the RfG network code), under revision to include grid-forming requirements; IEEE 2800-2022 for inverter-based resources in North America; AEMO’s voluntary grid-forming specification.
- Assets: synchronous condensers with flywheels, gas turbines with clutches for operation in synchronous mode, and grid-forming batteries. AEMO places these three assets at the centre of its 2025 Transition Plan for System Security.
A State that spends €29.5 billion in one year to lower the price, and much less to buy stability, is optimising the wrong variable. Physics does not accept budget transfers. Either you pay for the service, or you pay for the incident.
In plain language. Think of a heavy bicycle wheel spinning. If you give it a tap, it hardly slows down; a light wheel brakes at once. The large turbines of thermal and hydro power stations are heavy wheels: they store energy in their own motion and give the system a few seconds of tolerance when something fails. Panels and batteries have no wheel, unless they are programmed to imitate one, and that is what grid-forming is. Voltage is like the water pressure in the pipes of a block of flats: if nobody regulates it, the pipes burst on one floor and no water comes out on another. On 28 April 2025, the “pressure” rose and the equipment disconnected itself to protect itself, one after another.
What works
The known solutions have a common denominator: they return the cost to whoever causes it or whoever can avoid it.
- 1. Locational signals. Nodal pricing (ERCOT, PJM) or zonal pricing (the Nordic countries, Italy) tells each investor where their MWh is worth most. Without them, the signal has to come through differentiated grid tariffs or auctions with a locational criterion.
- 2. Two-sided contracts for difference. Regulation (EU) 2024/1747 requires that, from 1 July 2027, direct support for new wind, solar, geothermal, run-of-river hydro and nuclear generation take the form of a two-sided CfD or equivalent. The producer pays back the revenue above the strike price, and the asymmetry of the market premium disappears.
- 3. Zero payment at negative prices. It removes the incentive to produce when the system is paying for production not to happen.
- 4. Paid flexibility. Storage, flexible demand and dynamic tariffs turn the production profile into an asset instead of a cost.
- 5. Contracted system services. Inertia, system strength and voltage control specified and procured, as in Australia, instead of presumed.
- 6. Joint planning of generation and grid. The British strategic spatial energy plan (SSEP) and the synchronisation point between renewables and grid in the German plan recognise the same principle: generation cannot grow faster than the grid that carries it.
None of these measures is free in the short term. All of them reduce the system cost in the long term. The price subsidy does exactly the opposite.
In plain language. The two-sided contract for difference is like an agreement with the baker: you agree on 1 euro for the bread for ten years. If the market price falls to €0.80, the customer makes up the difference. If it rises to €1.30, it is the baker who pays back the 30 cents. Nobody gains from good luck or loses from bad luck. The locational signal works as in property: a house near the underground is worth more, and that is why that is where people build. In electricity, it should be worth more to produce where the grid has capacity to carry it.
Risks and single points of failure
A strategy based on subsidising the price turns the Budget into a single point of failure of the power system.
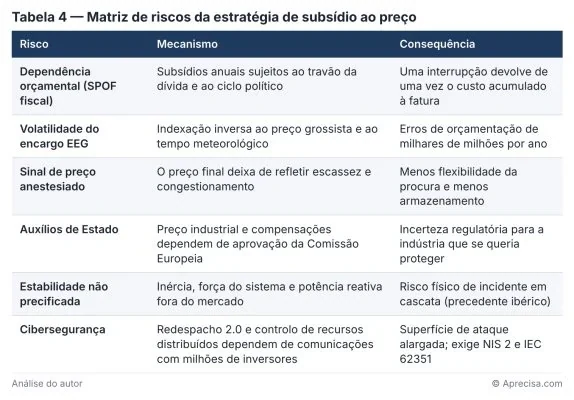
Table 4 shows that the risks are not independent. The anaesthetised signal reduces flexibility. The lack of flexibility worsens congestion and the EEG cost. That cost weighs on the Budget again. It is a positive feedback loop, and no control engineer would accept closing it without damping.
The cybersecurity row deserves attention of its own. The more the system depends on distributed resources to be stable, the more its stability also depends on the integrity of the communications that command them. The power grid and the data network have become a single cyber-physical system.
In plain language. A single point of failure is the only bridge linking a village to the rest of the country: if it falls, everything is cut off. When the stability of the bill depends on a subsidy voted every year, the Budget becomes that bridge. The feedback loop is like a broken thermostat that, the colder it feels, the more it switches the heating off: each turn makes the next one worse.
The lesson for Portugal
The German lesson is not “do not follow the model”. It is: do not repeat the architectural error that the model revealed.
Portugal today has an advantage that Germany no longer has: it can still design the accounts before paying the bill. The Study on the Total Costs of the System (Estudo sobre os Custos Totais do Sistema), launched by the DGEG (Portugal’s Directorate-General for Energy and Geology), is the right instrument, provided it measures what matters. Three principles should guide it:
- 1. Measure by system cost, not by technology cost. Every expansion decision should be assessed by the marginal SLCOE it introduces, with the profile, grid, balancing and stability terms quantified.
- 2. Full responsibility for the cost introduced. This is the principle of the proposed Integral Energy Responsibility Act (Lei REI, from the Portuguese Lei da Responsabilidade Energética Integral), which I presented to the DGEG in May 2026, in the public consultation on the Study on the Total Costs of the System: whoever adds an integration cost to the system answers for it, either by paying it or by providing the service that cancels it.
- 3. Synchronise generation, grid and stability. No renewable-capacity auction without the corresponding transmission capacity and without the system services contracted. 28 April 2025 has already shown us the price of the alternative.
In plain language. Whoever builds a new block of flats pays for the connection to the sewers, the water and the road, and does not leave that bill to the neighbours. The proposed Lei REI applies the same principle to electricity. Whoever connects to the system a power station that forces the grid to be reinforced or stability to be contracted contributes to that cost, or provides the service themselves, for example with batteries that help to hold the frequency.
The proposed Lei REI in summary
The proposed Lei REI translates the principles of this article into concrete obligations for the National Electricity System (SEN). It was presented to the DGEG in May 2026, in the contribution to the public consultation on the terms of reference of the Study on the Total Costs of the System, for possible adoption as a ministerial instrument. It is not, at the time of writing, law in force.
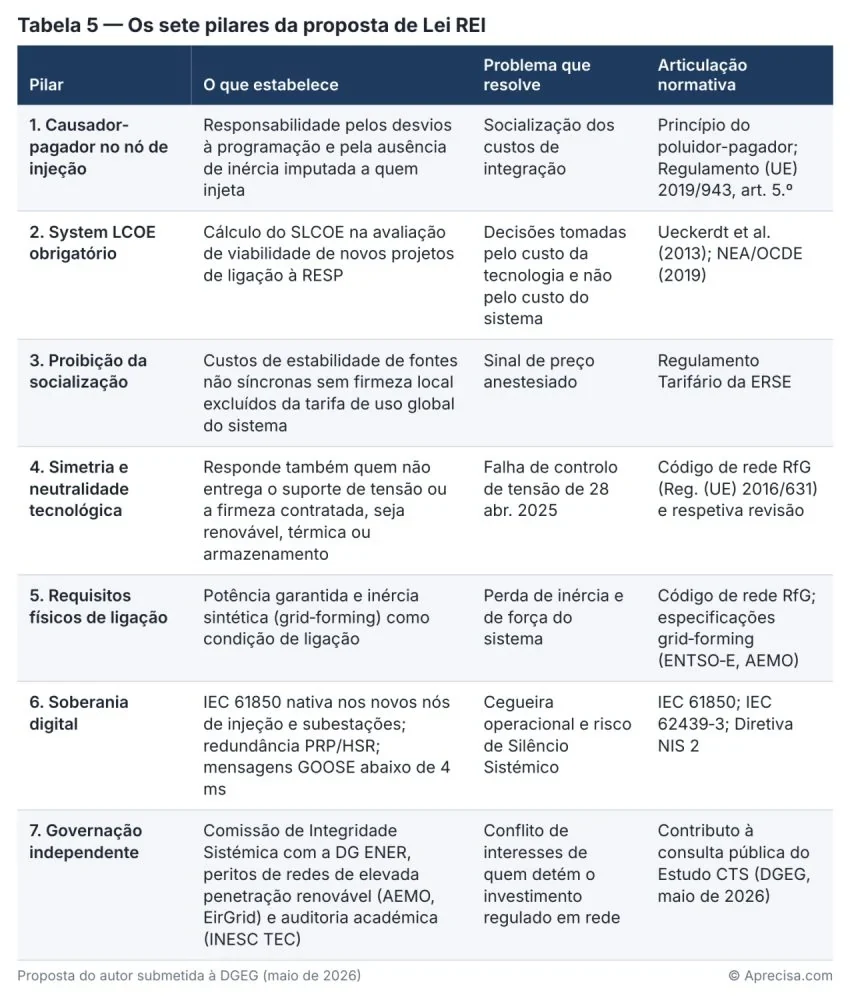
Table 5 shows that the proposal is not an abstract principle, but a set of verifiable obligations. Read together with the road map in the next section, the correspondence is direct: pillar 2 puts step 1 (measure) into practice; pillars 1 and 3, step 2 (attribute); pillars 4 and 5, step 4 (contract); pillar 6, step 6 (protect). Pillar 7 gives credibility to all the others, because it guarantees that whoever measures is not whoever charges.
Pillar 4 deserves to be underlined. The proposal is not against any technology. On 28 April 2025, conventional power stations also failed the required voltage control. Responsibility follows the physical cause, not the colour of the technology.
In plain language. Think of a block of flats. Whoever installs an air conditioner that trips the building’s electrical board pays for reinforcing the board (pillar 1), and the caretaker who should have been watching the board and did not also answers for it (pillar 4). Each flat has its own meter, so that it is known who uses what (pillar 2), and nobody can put their share on the common bill (pillar 3). The board has good-quality circuit breakers (pillar 5) and an alarm that gives warning in milliseconds (pillar 6). The accounts are checked by an external auditor, and not by the electrician who charges for the work (pillar 7).
How the architectural error is corrected
The error is corrected in seven steps, in this order, because each depends on the one before. Withdrawing the subsidy is the last step, never the first.
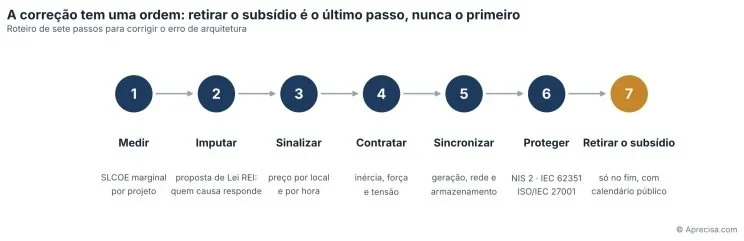
Figure 4 sums up the correction in a single line of reading. The first six steps, in blue, build the architecture that makes the subsidy unnecessary. The seventh, in amber, is the withdrawal of the subsidy, and it is only safe when all the previous ones are working. The direction of the arrows is the message: reversing the order is repeating the German error.
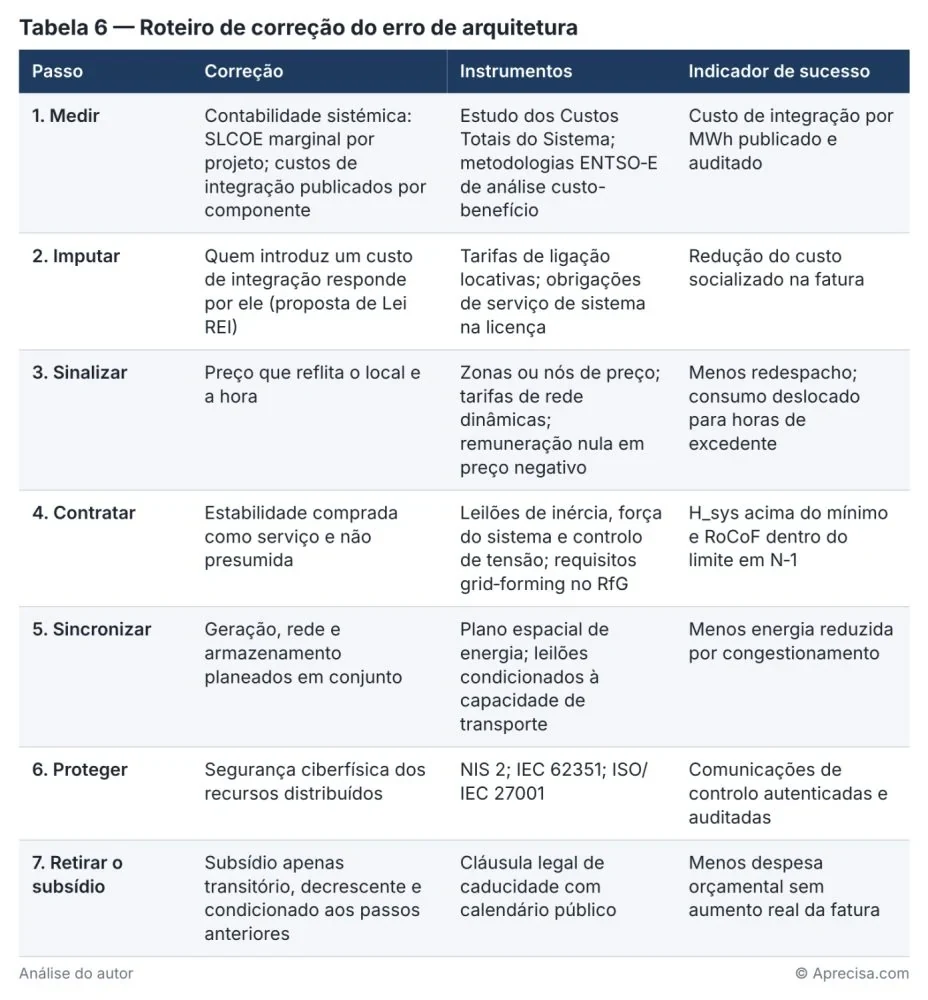
Table 6 details each step, the instruments and the indicator that makes it possible to check whether the step has been accomplished. The order is not a matter of indifference. Without measuring, one does not know what to attribute. Without attributing, the price signal has no content. Without contracted services and a synchronised grid, withdrawing the subsidy causes a shock on the bill and a political reaction that takes the system back to the starting point. Germany started at the end: it subsidised first and is now trying to measure.
In plain language. Correcting the error is like reorganising the traffic of a city that jams every day. First you count the cars in each street (measure). Then you decide that whoever builds a shopping centre pays for the access roundabout (attribute). You install a toll that costs more at rush hour (signal). You contract smart traffic lights and traffic police (contract). You widen the streets at the same time as the neighbourhoods are built, and not ten years later (synchronise). You protect the traffic lights against anyone who wants to switch them off (protect). Only then do you stop paying for the fuel of those stuck in the jam (withdraw the subsidy). Whoever starts with the last step only swaps a paid-for queue for an angry queue.
Conclusion
Germany’s €29.5 billion does not measure a disaster. It measures a choice: paying the symptom with taxes instead of paying the cause with engineering. The cost of renewable production has already fallen. The cost of integrating it is rising faster, and the price subsidy only prevents it from being seen.
A power system is not a sum of power stations. It is an architecture that has to hold 50 Hz in every second, at every node, in the face of every incident. Whoever governs it by the price of the MWh is looking at the dial and not at the submerged keel (quilha submersa).
“Incompetence” is a short word. “Architectural error” is the diagnosis. And an architectural error is not corrected with money. It is corrected with rigour.
Gaspar do Amaral
Illustrations and tables: © Aprecisa.com, AI-assisted.
Methodological note
What this page is. A translation of the essay the author published on LinkedIn on 7 October 2026; the full Portuguese version is on this site. The original has no separate methodological note: the sums are made in the text itself and in the captions of the figures, and they are reproduced here unchanged.
Numbers and units. The original writes amounts as “mil M€” (thousand million euros); in English they are written as “billion euros” (1 billion = 1,000 million). The numbers are those of the original; only the decimal separator follows English usage (14 600 in the original = 14,600).
Names and terms. German and Portuguese terms without an established English equivalent are kept in the original with an explanation in brackets at their first occurrence: EEG (Renewable Energy Sources Act), KTF (Climate and Transformation Fund), anzulegender Wert (reference value), Dunkelflaute, DGEG, SEN, RESP, ERSE. The author’s own concept is kept in Portuguese: Lei REI (Integral Energy Responsibility Act), a proposal and not law in force.
Changes of form, not of content. The thirteen original images (four figures, six tables and three equations) are reproduced as they are, with their texts in Portuguese; each caption translates the original caption and the texts of the image, and identifies the tables that had no caption on the page. The numbered lists of the original are shown with their numbers. The annotated references keep the titles of the sources in their original language.
References
- Harici — German government to spend record €29.5 billion on electricity subsidies in 2026 — summary of the IW calculations for Handelsblatt; source of Table 1
- ZfK — EEG-Konto 2025: 16,5 mil M€ de transferência federal — execution in 2025 and the effect of the Dunkelflaute on the cost
- pv magazine — EEG-Konto schließt 2025 mit Überschuss ab — payments of €18.5 billion and market revenue of €2.25 billion
- dpa-AFX / Bundesnetzagentur — Netzengpassmanagement 2025 — congestion management of about €3.1 billion and a renewable share of 60% of the curtailed volume
- ZfK — Redispatch 2025: PV-Abregelung im Verteilnetz — congestion shifting to the distribution grid
- BMWE — Monitoring der Energiewende (setembro de 2025) — EWI/BET report and Minister Reiche’s ten measures
- Modo Energy — Constraints in Great Britain — constraint costs of £1.9 billion in 2024/25 and projection to 2030
- HSF Kramer — REMA Update: GB zonal pricing rejected — British decision of 10 July 2025
- pv magazine — ENTSO-E final report on the Iberian blackout — summary of the final report of March 2026
- AEMO — Victorian System Strength Requirement, PADR (abril de 2025) — synchronous condensers and grid-forming batteries
- pv magazine — AEMO 2025 Transition Plan for System Security — Australian strategy for replacing synchronous inertia
- Regulamento (UE) 2024/1747 (EUR-Lex) — reform of electricity market design; two-sided CfDs from July 2027
- NEA/OCDE (2019) — The Costs of Decarbonisation: System Costs with High Shares of Nuclear and Renewables — reference quantification of system costs
- Ueckerdt, F. et al. (2013), System LCOE: What are the costs of variable renewables?, Energy 63 — formal definition of the SLCOE
- Hirth, L. (2013), The market value of variable renewables, Energy Economics 38 — cannibalisation effect on market value
The discussion is on LinkedIn (in Portuguese)
Comments on this text are made on LinkedIn, where the article was shared in Portuguese. You are welcome to write in English. Agree, disagree or add data: every well-founded objection receives a reply.
Gaspar do Amaral · Original in Portuguese of 7 October 2026, published on this site; translation issued on 27 October 2026 · Figures and tables © Aprecisa.com · AI-assisted