 ← Grupo Aprecisa · Connecting those who know with those who need
Engineering · Energy · Data
The Worst Weeks We Have Already Had
Twelve years of electricity in Portugal, hour by hour: how many wind lulls there were, how long they lasted and who kept the system going
Gaspar do Amaral · 13 October 2026
Translated from the Portuguese original. This version was issued on 27 October 2026.
On this site, this article has been
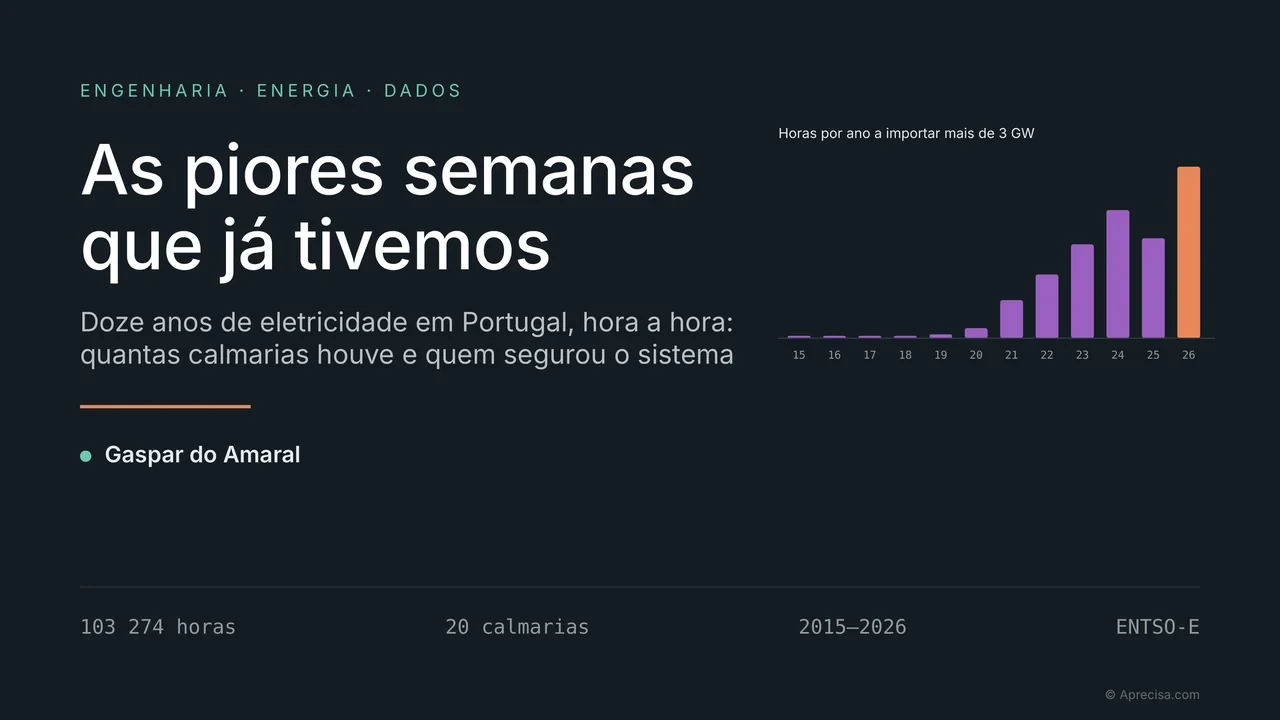
On Saturday, 10 October 2026, the wind stopped in mainland Portugal. Over the next three days, wind power produced less than a tenth of its installed capacity. On average, during that period, 2.8 GW arrived from Spain, more than half of consumption; in one of the hours, 4.4 GW. The gas-fired power stations, with about 4.4 GW installed, produced on average less than 0.7 GW. It went unnoticed. It was the twentieth wind lull of four or more days since 2015.
In technical discussions about security of supply, a prolonged lack of wind is usually dealt with using scenario figures. One objection always remains open: they are models. This article answers with what actually happened. From the transparency platform of the European network of transmission system operators (ENTSO-E), I gathered consumption, generation by technology and exchanges with Spain, hour by hour, from 1 January 2015 to 13 October 2026: 103,274 hours.
In practice. Instead of guessing how many weeks without wind we will have, I went and counted the ones we have already had, saw how long they lasted and saw who kept the lights on in people’s homes while the wind was not blowing.
I. The data
The data are those that REN (the Portuguese transmission system operator) reports to ENTSO-E: actual total consumption, actual generation by technology, installed capacity by technology and physical flows across the border with Spain, in both directions. Before using them, I checked them. Consumption in 2025 comes to 53.04 TWh; REN published 53.1 TWh. Generation plus the balance of exchanges with Spain matches consumption, year by year, except for the energy spent on pumping, which the platform does not include in consumption.
There is one limitation that should be stated straight away. The solar capacity and generation recorded on the platform correspond to the power stations that report to the operator; they do not include self-consumption or a large part of decentralised generation. For that reason, I use solar as part of generation, but I do not calculate its capacity factor. Wind lulls are defined by wind power.
I define a lull day as a day on which wind power produces, on average, less than 10% of installed capacity; and a wind lull as a sequence of consecutive days in those conditions. The threshold is a convention; the results with 8% or 12% are in the methodological note and do not change the conclusions.
II. How many wind lulls, and when
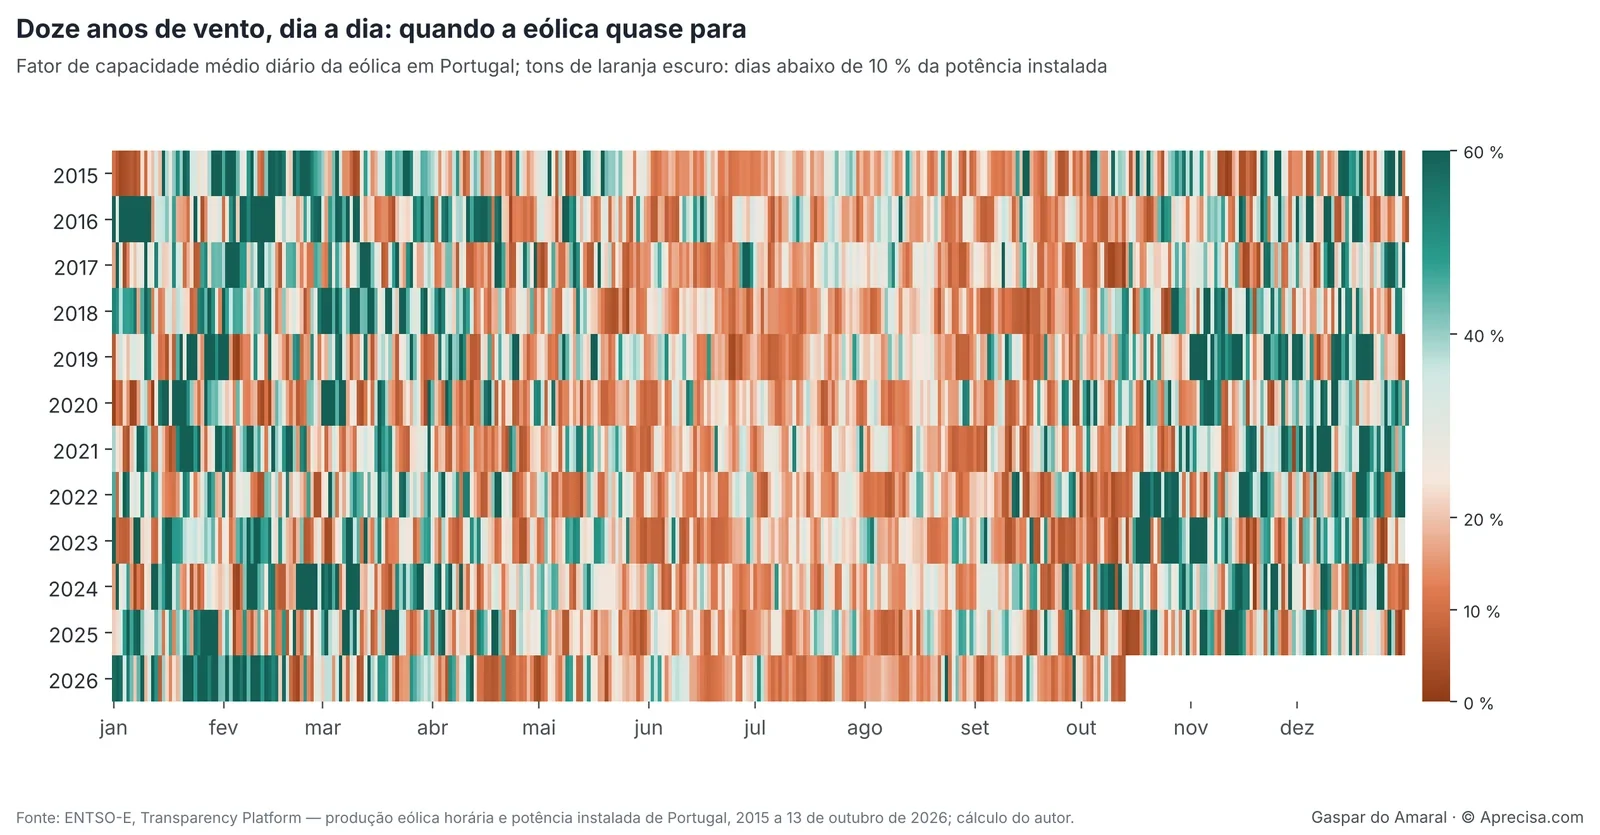
Figure 1 shows every day of the twelve years, one year per row. Each cell has the colour of the average wind capacity factor on that day: dark green when wind power produced more than half of its capacity, dark orange when it produced less than 10%. Two things stand out. The first is that days of weak wind are not rare: between 33 and 62 a year. The second is that they are concentrated at the end of summer and in autumn, in September and October, and in spring, in April and May. In the months of highest consumption, December to February, dark orange is less frequent. The figure contradicts the usual picture that the wind problem is mainly a winter problem.
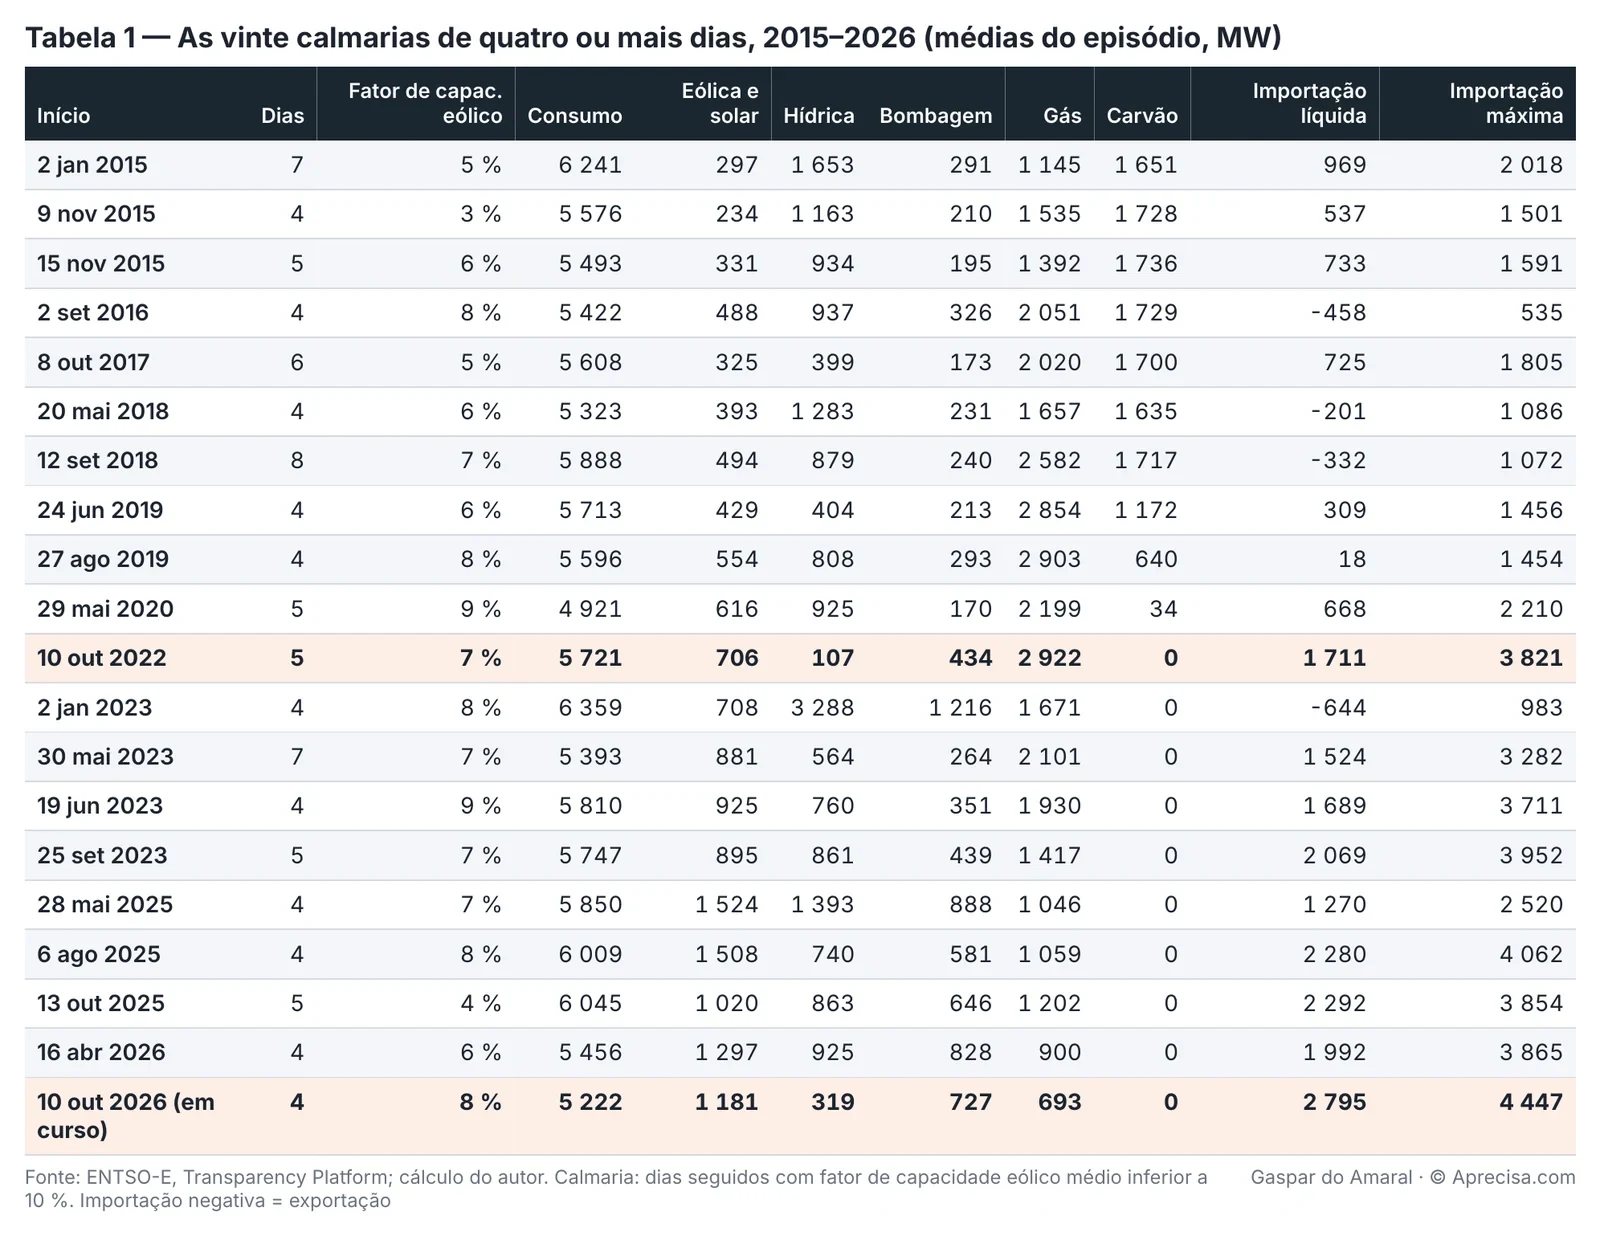
In figures: one day in four in September was a lull day (23%); in October, one in five (19%); in December and January, about one in ten. Since 2015 there have been 20 wind lulls of four or more days, nine of them of five or more. The longest lasted eight days, in September 2018. Only two fell in January: the one from 2 to 8 January 2015, with seven days, and the one from 2 to 5 January 2023.
III. The worst real week is smaller than the scenario
A reference scenario used in those discussions is that of 2 GW missing for 120 hours: 240 GWh. The data make it possible to measure how much wind power failed to produce in the worst five-day window of each year, compared with its average output in that year. The result is remarkably stable: between 116 and 158 GWh, in every year. The maximum was in October 2025.
The explanation is physical. With about 5.4 GW installed, Portuguese wind power produces 1.5 GW on average. Even if it stopped completely for five days, about 180 GWh would be missing. The 240 GWh of the scenario are only possible in a system with much more wind power than today’s, which is in fact what the National Energy and Climate Plan foresees. This corrects the scale of the previous article, not its conclusions: the costs per unit of energy and the ranking between solutions remain, and the scenario is now read as the problem of 2030 rather than that of today.
In practice. Today, the worst week of wind takes about 150 GWh away from the system, the equivalent of one whole day of the country’s consumption. With twice the wind power, the same week will take away twice as much.
IV. Who keeps the system going when the wind stops
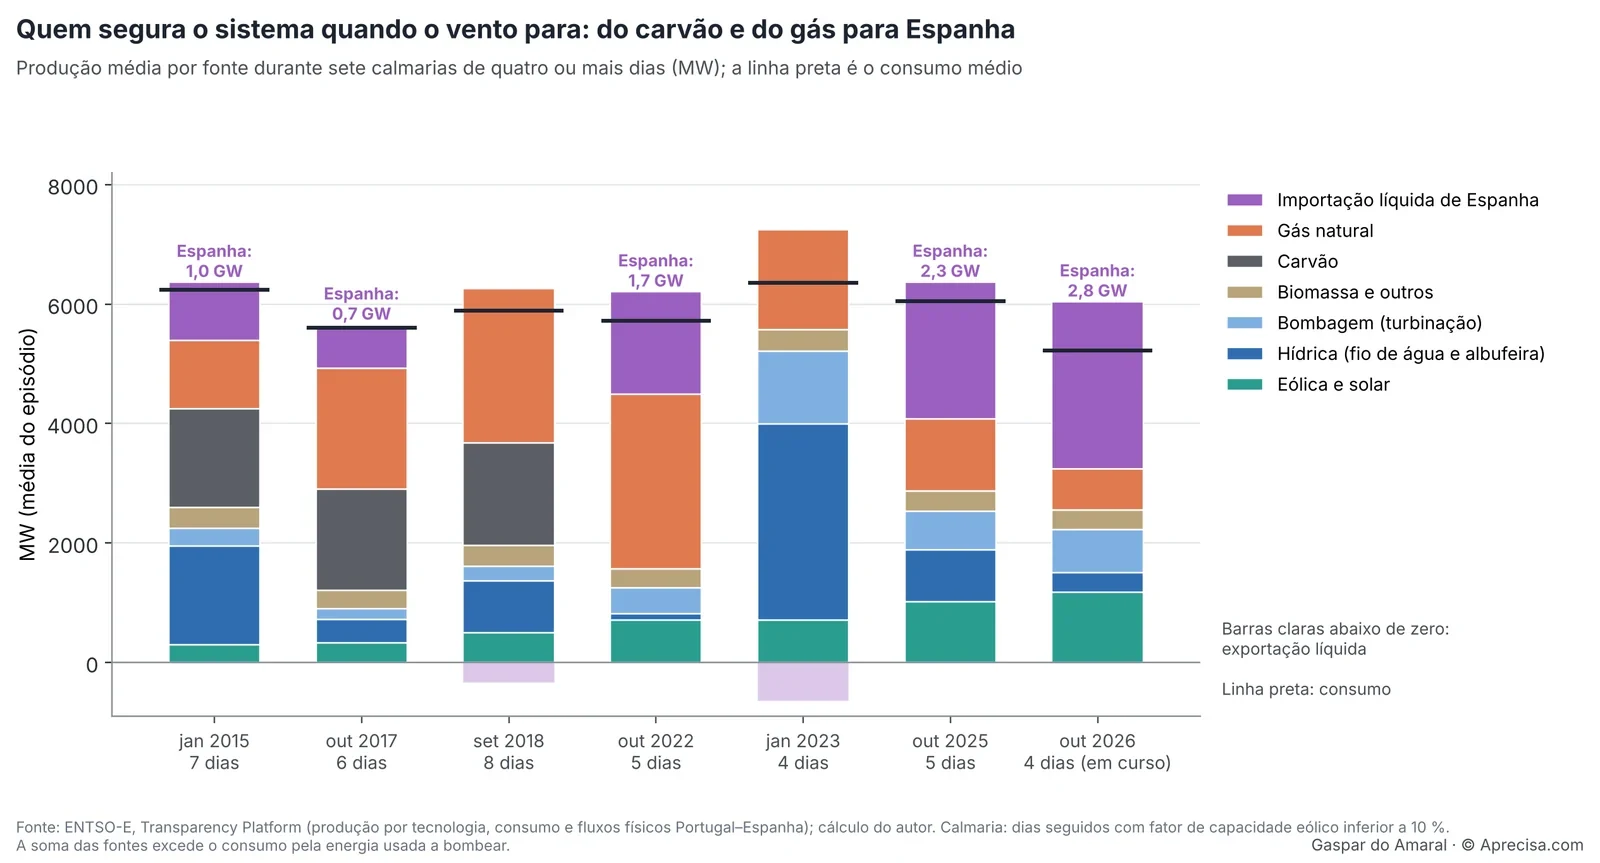
Figure 2 shows, for seven wind lulls of four or more days, the average output of each source during the episode; the black line is average consumption, and the part of the bars above it is mainly the energy used for pumping. Read from left to right, it tells the story of the system’s transformation over eleven years. In January 2015, the lull was covered by coal (1.7 GW), water (1.7 GW) and gas (1.1 GW), with 1 GW from Spain. In September 2018, Portugal even exported during the lull. In October 2022, with no coal and no water, it was gas (2.9 GW) with Spain (1.7 GW). In October 2025 and October 2026, Spain became the first source: 2.3 and 2.8 GW on average, with gas reduced to 1.2 and 0.7 GW. The figure says one thing only: the reserve for wind lulls has moved to the other side of the border.
Table 1 shows that the pattern is general. In the wind lulls up to 2019, average imports were a few hundred MW and, in three of them, Portugal exported. In the wind lulls since 2022, average imports were between 1.3 and 2.8 GW, with hourly maxima between 2.5 and 4.4 GW. The exception is January 2023, with the reservoirs full: hydro produced 3.3 GW on average and Portugal exported.
V. When water and wind are missing at the same time
The scenario most feared by planners is a dry year coinciding with a wind lull. It happened in October 2022.
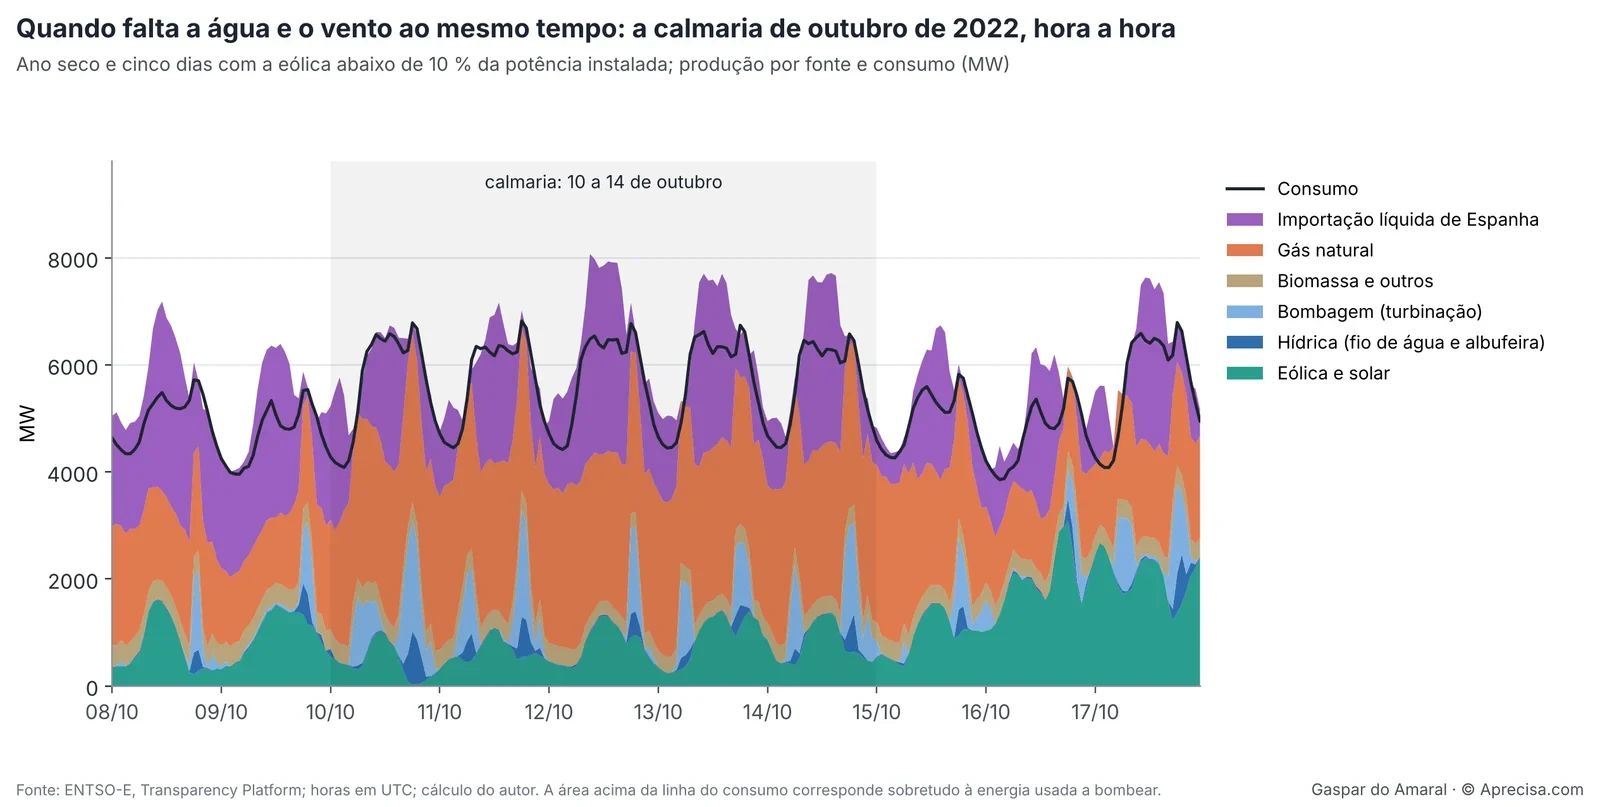
Figure 3 shows, hour by hour, ten days of October 2022; the shaded area is the wind lull, from 10 to 14 October. The dark blue layer, run-of-river and reservoir hydro, almost disappears: it produced 107 MW on average, and in some hours 6 MW. The system held with gas, which reached 3.2 GW, with pumped storage at the peaks and with Spain, which reached 3.8 GW in the late afternoons. The figure shows what the security-of-supply report describes in the abstract: in a dry year, the hydro reserve shrinks precisely when the wind is missing, and what remains is thermal capacity and the interconnection.
In 2022, Portugal still had about 4.5 GW of gas-fired power stations running 41% of the time, on average. Today, those power stations run about 20% of the time, and one of them, Tapada do Outeiro, is scheduled to close. The same wind lull, with the same drought, would today have to be covered by more Spain.
VI. Spain has become the reserve
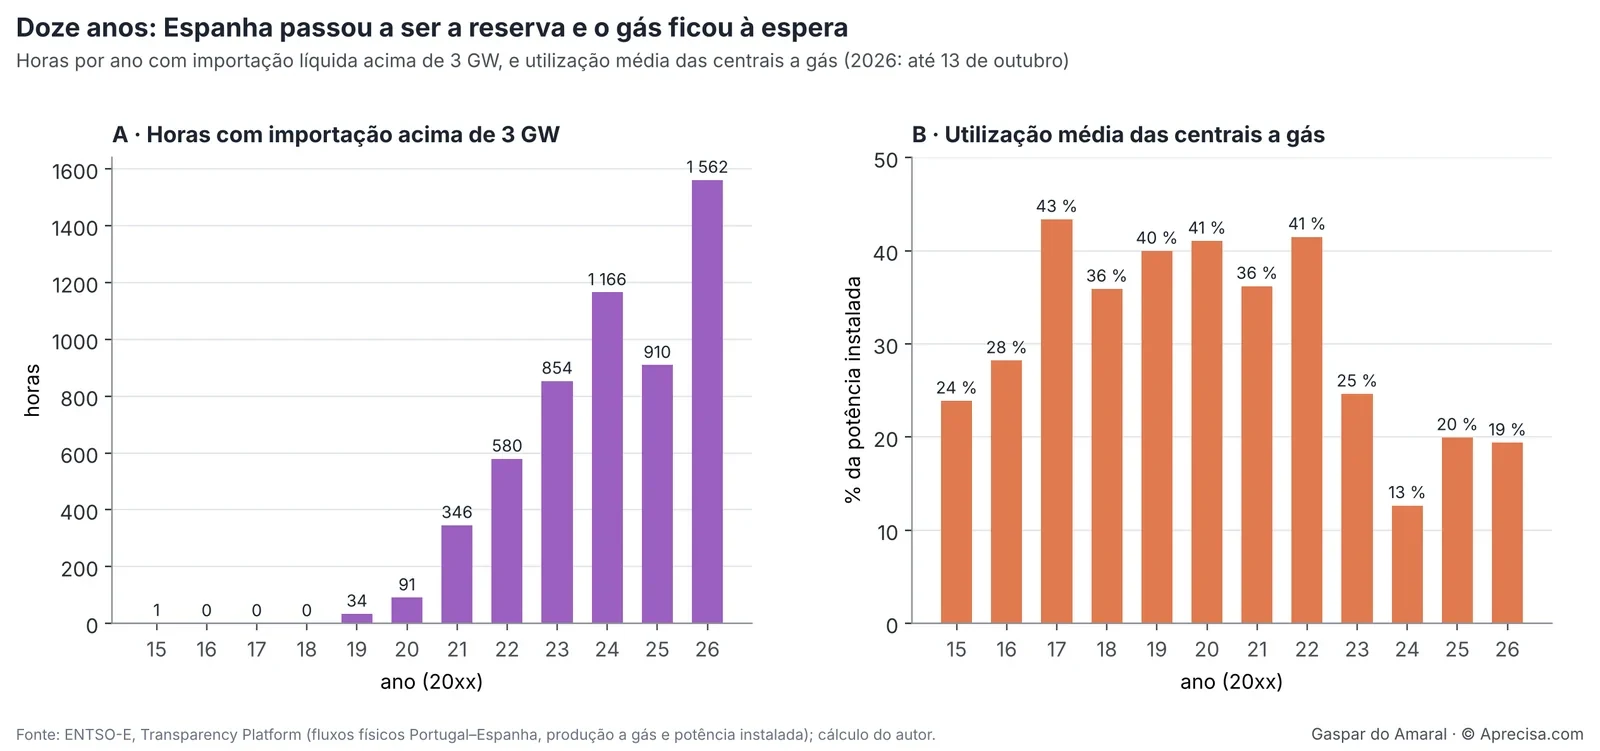
Figure 4 sums up the change in two numbers per year. On the left, the hours in which Portugal imported more than 3 GW net from Spain: one in 2015, none between 2016 and 2018, 1,562 in 2026 up to October. On the right, the average utilisation of the gas-fired power stations, as a percentage of installed capacity: between 36% and 43% from 2017 to 2022, 13% in 2024, about 20% in 2025 and 2026. The two halves tell the same story. Since the closure of coal and, above all, since 2023, the energy missing in the difficult hours comes more and more from Spain, and the gas-fired power stations, which are the national firm reserve, run less and less. Running less is exactly what makes them unprofitable in the market, as the European adequacy assessment concluded.
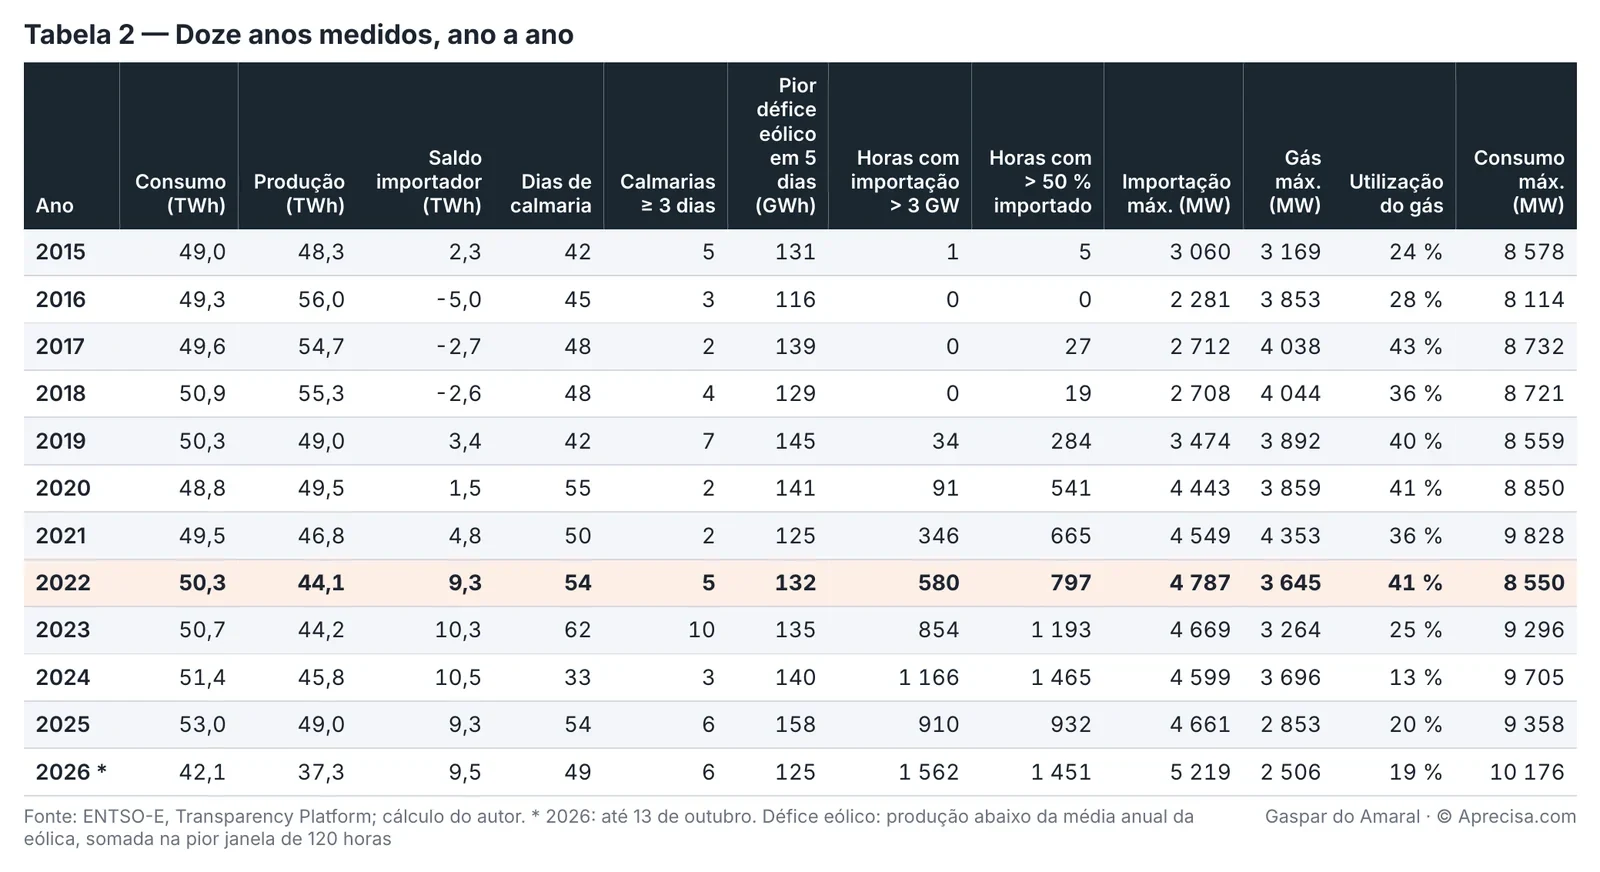
Table 2 adds three facts. The hours in which more than half of consumption came from Spain went from 5, in 2015, to 1,451 in 2026, up to October. The maximum imports in one hour rose from 3.1 GW to 5.2 GW (on 4 September 2026). And the maximum gas output in one hour fell from 4.4 GW, in 2021, to 2.5 GW in 2026. The capacity is still installed; the data measure what it produced, not what would have been available if it had been called on.
VII. The worst late afternoon
The two hours of highest consumption in these twelve years illustrate the difference between a good and a bad winter. On 12 January 2021, at 7 p.m., during a cold spell, consumption reached 9,828 MW with wind power producing only 229 MW. The system held with gas at 4.1 GW, close to the maximum installed, water at 2.9 GW, pumped storage at 1.4 GW, the Pego coal-fired power station still in service and 0.5 GW from Spain. On 20 January 2026, also at 7 p.m., consumption broke the record: 10,176 MW. This time there was wind (2.8 GW) and water (3.2 GW plus 2.4 GW of pumped storage), and 1.2 GW of gas was enough, with almost no imports.
The winter of 2026 was, therefore, the favourable case. It does not contradict the “estádio de rutura” (breaking-point stage) that the security-of-supply report foresaw for this year, because that stress test asks what happens in the unfavourable case: a January like that of 2021, without wind and with cold, but without the Pego coal-fired power station and with less gas available. The data show that this case happened in January 2021.
VIII. What the data tell the models
The European adequacy assessment assumes that the interconnection with Spain is always available, and the data show that, in the recent wind lulls, Spain did in fact supply between 2 and 4.4 GW. But the same data do not say whether Spain had a surplus or was itself at the limit: for that, the Spanish series are needed. The European model suggests that, when Portugal is short, Spain is almost always short too. The measured data do not yet allow this to be confirmed or refuted.
On the side of the national report, the data confirm what it fears: hydro is lacking in dry years, coal has disappeared, and gas, which still covered the wind lulls up to 2022, runs less and less and may close. They also show something the reports say little about: the longest and most frequent Portuguese wind lulls are not in winter, but at the end of summer and in autumn, when the reservoirs are at their lowest point of the year.
Conclusion
In twelve years, Portugal had 20 wind lulls of four or more days, about two a year, with the longest lasting eight days. The worst week of wind took between 116 and 158 GWh away from the system, less than the 240 GWh of the reference scenario, which only become possible with much more wind power. Wind lulls are more frequent in September and October than in winter, and they coincide with low reservoirs.
The most important change is not in the wind, which is the same, but in what replaces it. Up to 2019, the wind lulls were covered by coal, gas and water. Since 2023, they have been covered mainly by Spain, with national gas running less and less. It is a cheap solution as long as Spain has a surplus. The question that the Portuguese data do not answer, and that decides everything, is what happens on the day the wind lull is Iberian.
In one sentence. The worst weeks without wind have already happened, about twice a year, and the one that keeps the system going through them today is Spain; the risk is not in the wind lull, it is in the day it becomes Iberian.
Gaspar do Amaral
Text, tables, figures and calculations by the author, AI-assisted in processing the data and in checking. © Aprecisa.com
Methodological note
What this page is. A translation of the text the author published on LinkedIn on 13 October 2026, with the PDF attached; the full Portuguese version is on this site. The four figures and the two tables are the original images, with their texts in Portuguese, and translated captions. The hourly data used (Excel file, column headings in Portuguese) can be downloaded from the Portuguese page: as-piores-semanas-que-ja-tivemos_dados-horarios.xlsx. The annotated references are listed in the original order (A. Data: 1 and 2; B. Official reports cited: 3 and 4).
Data. ENTSO-E Transparency Platform, Portugal control area, hours in UTC, from 1 January 2015 to 13 October 2026, exported manually by the author: Actual Total Load [6.1.A]; Actual Generation per Production Type [16.1.B&C]; Installed Capacity per Production Type [14.1.A]; Cross-border Physical Flows [12.1.G], Portugal–Spain border, in both directions. The 2026 flows come in quarter-hours and were converted into hourly averages. The dataset has 103,274 hours with no gaps in consumption or generation.
Verification. Annual consumption matches that published by REN (53.04 against 53.1 TWh in 2025). The sum of generation and the import balance exceeds consumption by 1.6 to 5.5 TWh a year, a value consistent with the energy spent on pumping, which grows with the entry into service of the Tâmega system.
Wind lulls. Hourly wind capacity factor = (onshore wind + offshore wind) ÷ wind capacity installed in the year. Lull day: daily average below 10%. Wind lull: consecutive lull days. With the 8% threshold, there are 355 lull days and 16 wind lulls of three or more days; with 10%, 582 days and 55 wind lulls; with 12%, 843 days and 103 wind lulls. The wind lull under way on 13 October 2026 was analysed with the data available up to 02:00 on that day.
Wind deficit over five days. For each hour, the average wind output of the year minus the wind output in that hour; rolling sum over 120 hours; maximum of each year.
Coverage of the wind lulls. Hourly averages of each source during the episode. Hydro = run-of-river + reservoir; pumped storage = output from turbining at the reversible power stations; net imports = flow from Spain to Portugal minus flow from Portugal to Spain. The sum of the sources exceeds consumption by the energy used for pumping and by differences of scope between series.
Limits. The flows are physical, not commercial. The recorded solar excludes most decentralised generation, so total generation and the shares of solar are underestimated. The measured gas output is not the available gas capacity. I did not analyse the Spanish series, which are needed to know whether the wind lulls were also Iberian.
References
- ENTSO-E, Transparency Platform — consumption, generation by technology, installed capacity and physical flows of Portugal, 2015–2026; data exported by the author and included in the package.
- ECO (2026), citando a REN — consumption of 53.1 TWh in 2025, used in the verification.
- DGEG/REN, RMSA-E 2025 — stress test for 2026 and forecast closure of Tapada do Outeiro.
- ENTSO-E, ERAA 2025 — European resource adequacy assessment; assumption of an interconnection that is always available.
The discussion is on LinkedIn (in Portuguese)
Comments on this text are made on LinkedIn, where the article was shared in Portuguese. You are welcome to write in English. Agree, disagree or add data: every well-founded objection receives a reply.
Gaspar do Amaral · Original in Portuguese of 13 October 2026, published on this site; translation issued on 27 October 2026 · Figures and tables © Aprecisa.com · AI-assisted