 ← Grupo Aprecisa · Connecting those who know with those who need
Resilience · Newsletter «A Porta Estreita» (The Narrow Door)
Day 220: Bad luck never comes alone
«A Porta Estreita» (The Narrow Door), episode 2: the crises that arrive together
Gaspar do Amaral · 6 October 2026
Translated from the Portuguese original. This version was issued on 27 October 2026.
On this site, this article has been
Episode 2 of the series «A Porta Estreita» (The Narrow Door). A storm in Leiria and a strait in the Persian Gulf obey the same law: risks do not arrive one at a time. And the longer the crisis lasts, the less the second piece of bad luck is luck.
Before reading, answer in your head: if the power went off in your home for three days, how many things would stop at the same time? Keep the number. At the end of the article you will be able to check it.
Early hours of 28 January 2026. Six in the morning.
About one million customers without electricity in mainland Portugal. Storm Kristin brought down trees, poles and more than six thousand kilometres of power lines. It left five people dead.
But the lights were not the only thing to go out.
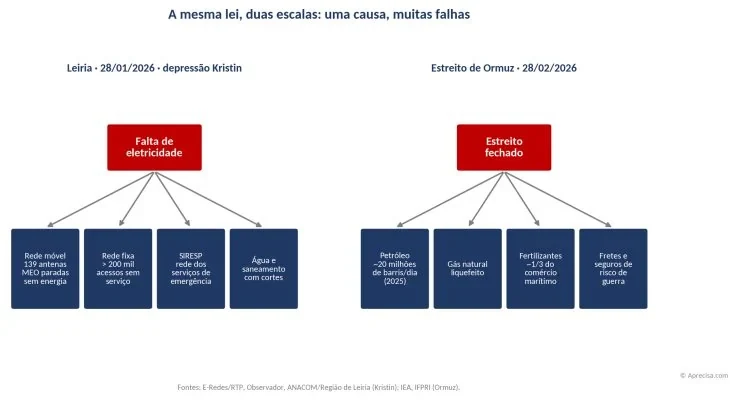
Days later, MEO still had 139 mobile network stations down — not because they were broken, but for lack of electrical power. SIRESP, the emergency services’ communications network, was also affected. ANACOM counted more than 200 thousand fixed accesses and 300 thousand mobile network users without service.
Three months later, about 20 thousand customers still had no fixed communications.
One storm. One cause. And suddenly there was no power, no network — and no way to call for help.
Risks do not arrive one at a time. They arrive in clusters.
A month later, on 28 February, six thousand kilometres from Leiria, the same thing happened on a planetary scale. The Strait of Hormuz closed and, on the same day, oil, gas and fertilisers stopped. That was the subject of episode 1 (in Portuguese).
Today, day 220
Today, 6 October, is day 220. The latest count published by PortWatch, of 27 September, recorded 1 crossing, against 85 a day before the crisis. In the early hours of yesterday, 239 ships with AIS switched on were stopped and waiting in the area of the strait and the Gulf — on Saturday there were 139. Between 1 and 4 October, UKMTO, the British maritime security centre, recorded four attacks in the Hormuz area. And Iran repeated that the strait will not reopen until seven conditions of the June agreement are met.
And here in Portugal, the narrow door is already felt in our pockets.
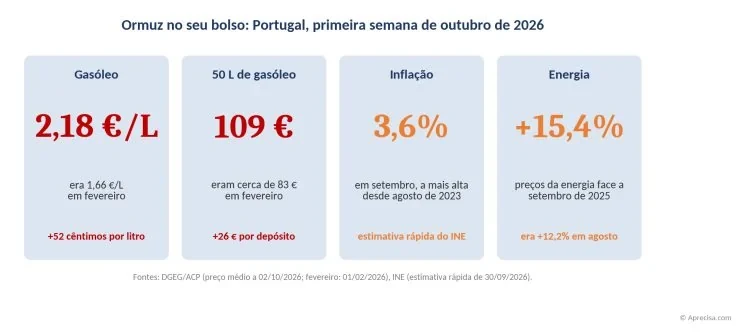
According to DGEG, diesel cost on average 2.180 euros per litre on 2 October; on 1 February, before the crisis, it cost 1.659 euros. A 50-litre tank became about 26 euros dearer. Inflation rose in September to 3.6%, the highest value since August 2023, with energy 15.4% dearer than a year ago. And the basket of 63 essential goods tracked by DECO cost 254.22 euros.
But the most important news this week did not come from the petrol bowser. It came from the plate. We will get there.
1. The same law, two scales
In episode 1 we saw the calculation that almost every emergency plan makes: two risks with a 10% probability each, independent, coincide 1 time in 100. A rare piece of bad luck.
Kristin showed the flaw in the calculation with Portuguese names. Electricity, the mobile network, the fixed network and the emergency network were not four risks. They were one, with four faces — because antennas, routers and water pumps all need the same thing: electric current.
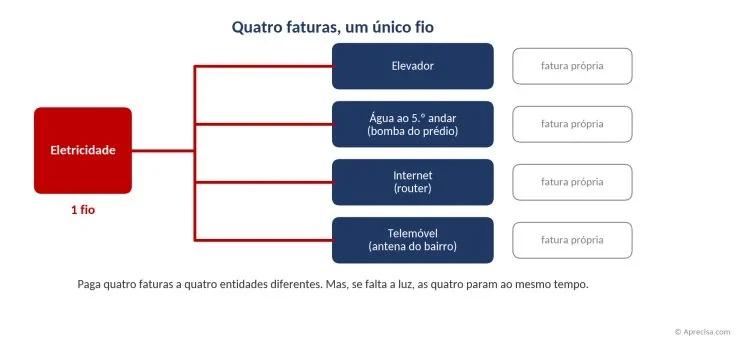
In everyday life: the power goes off in the building. The lift stops. The pump that takes water up to the 5th floor stops. The router stops. And, if the neighbourhood antenna has no battery for many hours, the mobile phone stops.
The equation says this: P(A and B) ≫ P(A) × P(B). When there is a common cause, the probability of the two failures happening together is much greater than the product of the separate probabilities.
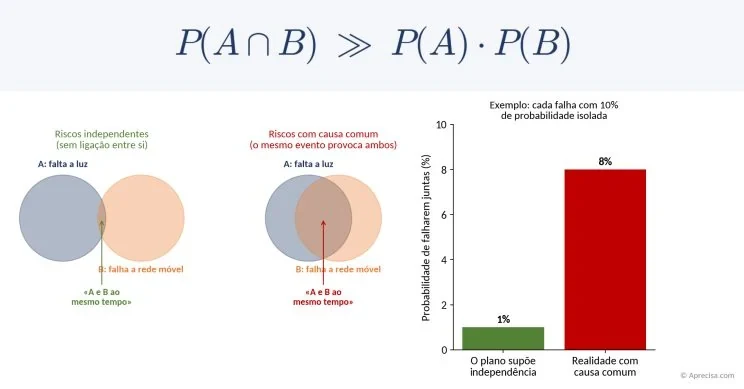
In 2026, even plan B was hit. The Saudi pipeline that bypasses Hormuz was the great alternative. Today it is operating at reduced capacity, and on 18 September Reuters reported that at least two European refineries had been told they would not receive Saudi crude in October. Plan A and plan B were exposed to the same conflict.
Four bills, a single wire.
Stop for 10 seconds: in your home, how many of your “plan Bs” also need electricity?
2. The longer it lasts, the less it is bad luck
There is a second face to bad luck coming twice, and it is the most treacherous. It does not need a common cause. It only needs time.
A short crisis rarely runs into another along the way. A long crisis almost always does. Not because of a curse — because of arithmetic.
In everyday life: if the car spends a week at the mechanic, it is unlikely that the washing machine will also break down that week. If the car spends seven months at the mechanic, it is almost certain that something else will break in the meantime — and then you no longer have a car to go and buy the part.
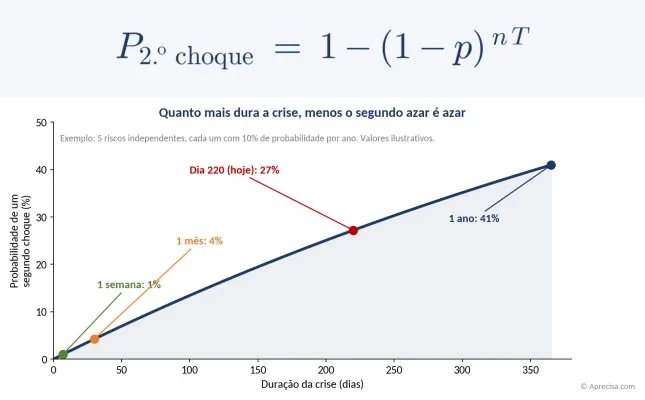
The equation: P = 1 − (1 − p) to the power of n·T, where p is the annual probability of each risk, n the number of independent risks and T the duration of the crisis in years.
With five risks of 10% a year, the probability of a second shock is 1% in a one-week crisis. In a 220-day crisis, it is 27%. After a year, 41%. (Illustrative values; the calculation assumes independent risks that are constant over time.)
In 2026, exactly this happened. While Hormuz remained closed, two shocks that have nothing to do with the Gulf joined in: logistical constraints in the Black Sea and dry weather in parts of North America. Three independent shocks fell on the same plate.
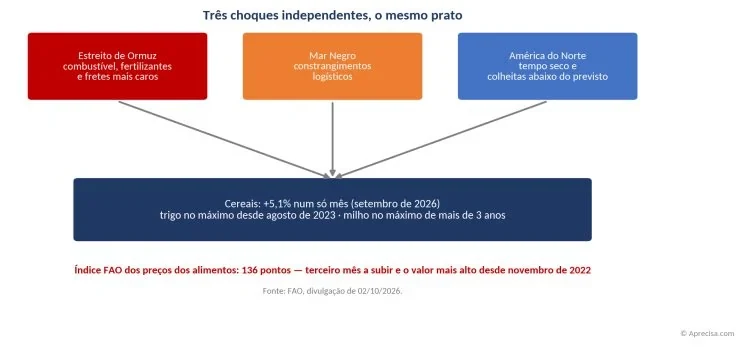
On 2 October, the FAO published the result. The Food Price Index rose for the third month in a row and reached its highest value since November 2022. Cereals rose 5.1% in a single month; wheat is at its highest since August 2023 and maize at its highest in more than three years. And the FAO added a warning: if these pressures persist, they will soon pass through to the prices consumers pay.
In episode 1 I wrote that fertiliser that arrives after sowing does not recover the harvest. I called it the fifth wave of the domino (dearer food). Seven months later, it has reached the table.
In a one-week crisis, the second piece of bad luck is bad luck. In a seven-month crisis, it is statistics.
3. A correction, because the facts rule
In episode 1 I pointed to urea — the most widely used nitrogen fertiliser in the world — as the weakest link. The facts have changed, and the series changes with them.
In India, the price of urea reached 935–959 dollars per tonne in April and fell below 400 dollars in September, thanks to China’s export quotas and alternative routes via the Red Sea and Suez. The “other suppliers” lever worked.
But there is a detail that confirms the law. With port warehouses full, fertiliser plants in the Middle East are being forced to cut production. The plant is ready. The product exists. But it cannot get out through the door.
The weakest link has not disappeared. It has moved: from the bag of fertiliser to the shopping basket.
4. What is being done — and what is still missing
After last winter’s storms, the Government is preparing an energy and communications plan for this winter. One of the measures is national roaming: if your operator’s network fails, your mobile phone will be able to use another operator’s network. The Army is also developing an autonomous mobile solution to support emergency relief.
National roaming is a good measure. It cuts dependence on a single operator. But Kristin teaches the limit: if the other operator’s antenna also loses power, roaming connects nothing. The common cause was not the operator. It was electricity.
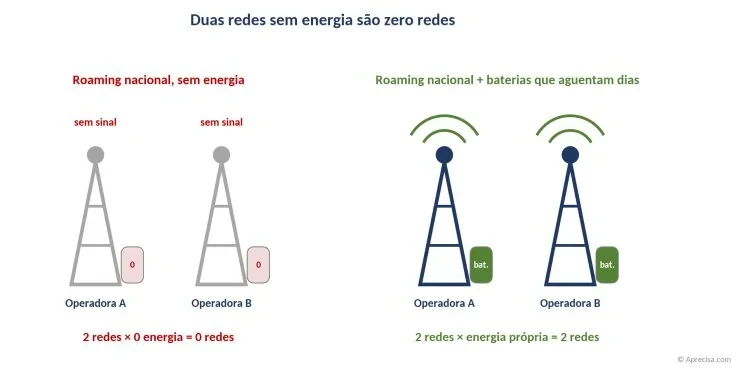
Two networks without power are zero networks.
The real separation lies in the electrical autonomy of each antenna — batteries and generators that last for days, not hours. In engineering this is called reducing the β factor, the share of failures that brings down both branches at once, according to the IEC 61508 standard.
Annex — The common-cause test (10 minutes)
A worked example and a form to do your own.
Step 1. Write, in rows, the goods you cannot do without: water, food, calling for help, buying what is missing, a medicine.
Step 2. Write, in columns, what those goods may depend on: electricity, the mobile network, an open road, the ATM, a person.
Step 3. Put a cross whenever a good depends on a column.
Step 4. Add up the crosses in each column. The column with the most crosses is your hidden common cause — your single point of failure.
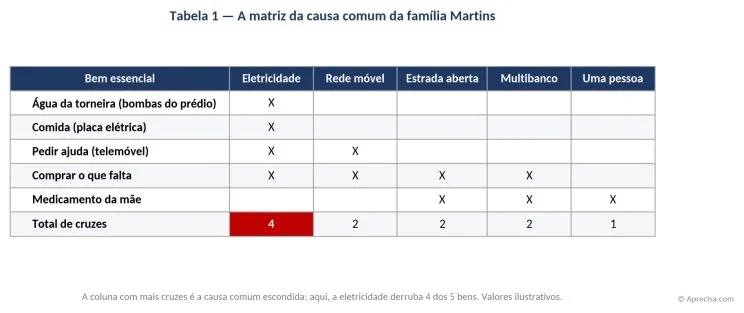
For the Martins family, electricity appears in four of the five goods. It is no surprise: it is what Kristin showed a million customers in a single night. The right measure is not to buy more of everything. It is to cut the red column where it is cheapest: a gas camping cooker, a charged power bank, stored water, some cash.
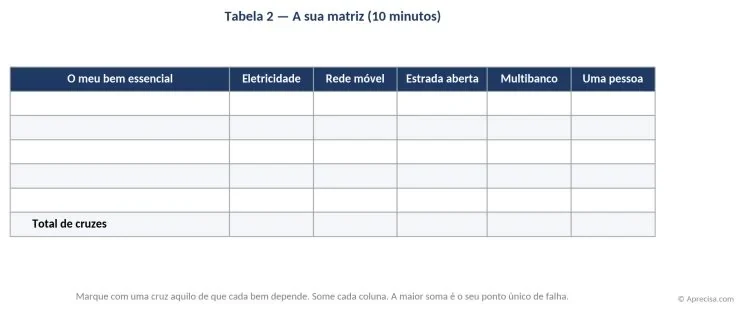
Note: the values in the example are illustrative and serve to teach the method. Always follow the recommendations of the civil protection authorities in your area.
Your number
Do you remember the number you kept at the start? Now do the test and answer in the comments with just one number, from 0 to 5: how many crosses does your electricity column have? In episode 3 I will publish everyone’s results, without names.
Do you know someone who runs a school, a health centre, a local council or a company? Send them this test. Ten minutes that can be worth days.
Resilience is not bought on the day of the crisis. It is decided long before it.
This is episode 2 of the series «A Porta Estreita». Next Tuesday, 13 October: 3. “O efeito dominó” (The domino effect) — why the shock we see today only reaches the supermarket months from now. And the results of your test.
Subscribe to the newsletter to receive each episode on Tuesdays.
Note on the count: the series counts the full days since 28 February; some monitors also count 28 February itself and show one day more.
Kind regards, Gaspar do Amaral
References
- RTP / Lusa (28/01/2026). About one million E-Redes customers without electricity at the peak of storm Kristin. https://www.rtp.pt/noticias/pais/cerca-de-408-mil-clientes-da-e-redes-sem-energia-pelas-15h30_n1714093
- ECO (28/01/2026). Customers without power and toll of victims of storm Kristin. https://eco.sapo.pt/2026/01/28/mau-tempo-cerca-de-485-mil-clientes-da-e-redes-sem-energia/
- Observador (2026). How communications are trying to restore the network: 139 MEO stations down for lack of power; impact on SIRESP. https://observador.pt/especiais/satelite-geradores-unidades-moveis-gestao-de-espectro-como-as-comunicacoes-tentam-repor-a-rede-depois-de-destruicao-sem-precedentes/
- Região de Leiria (04/2026). ANACOM: more than 200 thousand fixed accesses and 300 thousand mobile users affected; 20 thousand still without fixed service three months later. https://www.regiaodeleiria.pt/2026/04/cerca-de-20-mil-clientes-continuam-sem-servicos-fixos-de-comunicacoes-depois-da-tempestade/
- Tempo.pt (29/09/2026). Energy and communications plan for the winter: national roaming and the Army’s mobile solution. https://www.tempo.pt/noticias/actualidade/apos-as-tempestades-portugal-prepara-um-plano-de-energia-e-comunicacoes-para-este-inverno.html
- Straits.live (03 to 06/10/2026). Situation in the Strait of Hormuz: latest IMF PortWatch count, ships stopped and reduced capacity of the Saudi pipeline. https://straits.live/
- Straits.live — daily bulletin (05/10/2026). 239 ships with AIS stopped in the area of the strait and the Gulf. https://straits.live/briefs/2026-10-05
- Wikipedia — East–West Crude Oil Pipeline (consulted on 06/10/2026). European refineries without Saudi crude in October (Reuters, 18/09/2026). https://en.wikipedia.org/wiki/East%E2%80%93West_Crude_Oil_Pipeline
- DGEG / ACP, via O Digital (02/10/2026). Average price of diesel (2.180 €/L) and petrol (2.096 €/L). https://odigital.sapo.pt/combustiveis-descida-gasoleo-gasolina-5-outubro-2026/
- Contas Poupança (02/10/2026). Average price of diesel on 01/02/2026 (1.659 €/L). https://contaspoupanca.pt/carro/combustiveis/2026-10-02-preco-dos-combustiveis-na-proxima-semana--5-a-11-de-outubro--bf3fde87
- INE, via TSF (30/09/2026). Flash estimate: inflation of 3.6% in September; energy +15.4%. https://www.tsf.pt/economia/artigo/taxa-de-inflacao-acelera-para-36-em-setembro-impulsionada-pelos-combustiveis/18132018
- Jornal de Negócios (30/09/2026). Inflation at its highest value since August 2023. https://www.jornaldenegocios.pt/economia/conjuntura/detalhe/inflacao-acelera-em-setembro-para-3-6-puxada-pelos-combustiveis
- DECO Proteste, via Folha Nacional (30/09/2026). Basket of 63 essential goods: 254.22 euros. https://folhanacional.pt/2026/09/30/taxa-de-inflacao-acelera-para-36-em-setembro-impulsionada-pelos-combustiveis/
- Political.org (05/10/2026). Strait of Hormuz monitor: attacks recorded by UKMTO from 1 to 4/10 and the Iranian position on the seven conditions. https://political.org/strait-of-hormuz-tracker/
- FAO (02/10/2026). Food Price Index for September 2026. https://www.fao.org/newsroom/detail/fao-food-price-index-rises-in-september-amid-weather-concerns-and-transport-disruptions/en
- UkrAgroConsult (10/2026). Breakdown of the rise in cereals: Black Sea, drought in North America and Hormuz. https://ukragroconsult.com/en/news/global-food-prices-rise-in-september-on-grains-vegetable-oils-and-sugar-fao/
- Global Agriculture (03/10/2026). World food prices at their highest since November 2022. https://www.global-agriculture.com/global-agriculture/global-food-prices-climb-to-near-four-year-high-fao-says/
- SunSirs (10/2026). World urea market in the first three quarters of 2026. https://www.sunsirs.com/commodity-news/petail-36560.html
- IEC 61508 (—). Functional safety — treatment of common-cause failures (β factor). International Electrotechnical Commission.
#Resilience #CriticalInfrastructure #FoodSecurity #Telecommunications #RiskManagement #Portugal
Follow the waves, every day
The five waves of this series are measured every day on the «A Porta Estreita» dashboard (in Portuguese), with open data: the 1st, trapped energy (ships in Hormuz and Brent crude); the 2nd, dearer transport and fertilisers (the price of urea); the 3rd, less fertiliser in the fields (urea compared with wheat); the 4th, smaller harvests and dearer cereals (the FAO index); and the 5th, dearer food (food inflation and the DECO basket). Each number comes with the calculation done step by step, so that you can redo it with pencil and paper.
Think of a weather forecast: the article explains how storms form; the dashboard tells you what the weather is like today. And the series’ forecasts are recorded with the date on which they were made, so that the data themselves say whether they were right.
Open the dashboard · See whether the forecasts were right · For schools (in Portuguese)
Methodological note
What this page is. A translation of episode 2 of the series «A Porta Estreita» (The Narrow Door), published by the author on LinkedIn on 6 October 2026; the full Portuguese version is on this site. The day count (“day 220”) and all data are those of the original, as of 6 October 2026; they have not been updated.
Numbers. All numbers, dates, units and calculations are exactly those of the original; only the decimal separator follows Australian usage (2.180 instead of 2,180).
Changes of form, not of content. The decorative symbols (emoji) and separator lines of the LinkedIn version were left out, and the names Tempo.pt, Straits.live and Political.org, which LinkedIn had turned into web links, appear as plain text. The nine original images are reproduced as they are, with their texts in Portuguese; each caption translates the original caption and the texts of the image. The section “Follow the waves, every day” comes from the article’s page on this site. The links to sources are those of the original; the dashboard and episode 1 are in Portuguese.
The discussion is on LinkedIn (in Portuguese)
Comments on this text are made on LinkedIn, where the article was shared in Portuguese. You are welcome to write in English. Agree, disagree or add data: every well-founded objection receives a reply.
Gaspar do Amaral · Original in Portuguese of 6 October 2026, published on this site; translation issued on 27 October 2026 · Figures and tables © Aprecisa.com · AI-assisted