 ← Grupo Aprecisa · Connecting those who know with those who need
Energy and the electricity system
The worst week — How much it costs not to be left in the dark when the wind and the sun fail
… and why the answer is not in the price per MWh
Gaspar do Amaral and João de Jesus Ferreira · 15 October 2026
Translated from the Portuguese original. This version was issued on 27 October 2026.
On this site, this article has been
On 28 September 2026, at 21:16, Red Eléctrica asked a group of large Spanish industrial consumers to cut their consumption. 943 MW of demand left the grid, for a total of 1,634.5 MWh. The reason was simple: wind output fell short of the forecast. It was the ninth activation this year of the active demand response service, and the seventh since mid-July.
Two hours can be solved with almost anything: a battery, a gas power station, a factory that agrees to stop, the interconnection. The problem changes in nature when the lack of wind lasts for days. In the Iberian Peninsula there are high-pressure episodes in which the wind drops for several days in a row; if they coincide with short days, the sun does little to make up for it. On those days, an electricity system built on wind and solar needs something else to keep the lights on — and that something else has a cost that almost never appears in the charts comparing technologies.
This article answers just one question: how much does it cost, per year, to guarantee 2 GW for five days without wind or sun, two to three times a year? It compares four ways of doing it, translates the result into the bill of a family and of a factory, and shows where each solution can fail. Behind it lies a broader question, which the two authors share: it is not enough to know how much it costs to produce electricity; it is essential to know how much it costs to guarantee its supply, permanently, and who bears those costs.
The question is about power, not only energy. Security of supply requires that, at every instant, the available power meets demand, including reserves, regulation and the other system services. That is why it matters to distinguish three quantities that are often confused — installed capacity, energy produced and firm capacity actually available — and to look at the overall cost of the system, not just at the levelised costs of generation.
In practice: It is the difference between the price of petrol and the price of car insurance. The usual charts show how much each litre costs. The question of the worst week is how much it costs to be sure that the car runs on the day everything goes wrong.
I. A chart and the right question
This article began in a conversation between the two authors, in an engineers’ discussion group. João de Jesus Ferreira shared a chart of the levelised costs of several technologies: large nuclear at 155 €/MWh, small modular reactors (SMR) at 98 €/MWh for the first units and 70 €/MWh in series, and batteries at 680 €/MWh, sized to guarantee 2 GW for five days — 240 GWh of storage.
Gaspar do Amaral questioned two points. First, a first-of-a-kind SMR cheaper than a large reactor runs against experience: the first units of any nuclear technology are usually the most expensive. Second, lithium batteries are used today for 2 to 4 hours, not for five days. João de Jesus Ferreira agreed with the first point — the two values came from different investment bases, 7,150 €/kW for the SMR and 13,850 €/kW for nuclear, the latter with a North American reference — and clarified the second: the five-day scenario was deliberate, because that is the service that matters to a system with a lot of variable renewables. And he left the question that gives this article its title: how can demand be met hour by hour, including the prolonged periods of low output, and at what total cost?
João de Jesus Ferreira’s point of view: “The central problem of energy planning is not to identify the technology that produces electricity at the lowest levelised cost, but to determine which combination of technologies and resources makes it possible to meet demand, hour by hour, at the lowest overall cost and with adequate levels of security of supply. An electricity system cannot be planned solely on the basis of annual energy balances, installed capacity targets or percentages of renewable penetration. Wind and photovoltaic output depend on weather conditions that do not necessarily follow the evolution of demand. The decisive question is what firm and dispatchable capacity, what storage capacity, what demand flexibility and what effective contribution from interconnections will be needed to ensure the balance of the system, including in the most unfavourable periods. It is not enough to assess how much it costs to produce electricity when resources are available. It is essential to determine how much it costs to guarantee its supply when those resources are insufficient. This is the fundamental difference between the cost of a technology and the overall cost of a reliable, secure and competitive electricity system.”
The answer to this question does not fit in a chart of costs per MWh, for a reason that can be explained in a formula.
II. Price per litre and price of insurance
The cost of a storage installation per MWh delivered is obtained by dividing the annual cost by the energy it delivers per year. The annual cost is almost entirely fixed: depreciation of the investment and maintenance. The energy delivered depends on how many times the installation is filled and emptied. The same installation therefore has a very different price per MWh depending on how we use it.
This is the distinction between the LCOE (levelized cost of energy), the levelised cost of the energy produced by a technology, and the LCOS (levelized cost of storage), the levelised cost of the energy delivered by a storage installation under defined conditions of investment, operation and use. Neither of them, on its own, measures the cost of guaranteeing supply at a given level of reliability: for that, the cost of firm capacity, integration costs, networks and system services, and the effective contribution of each technology to adequacy also count. A technology can have a low LCOE and, at the same time, require investment in other parts of the system.
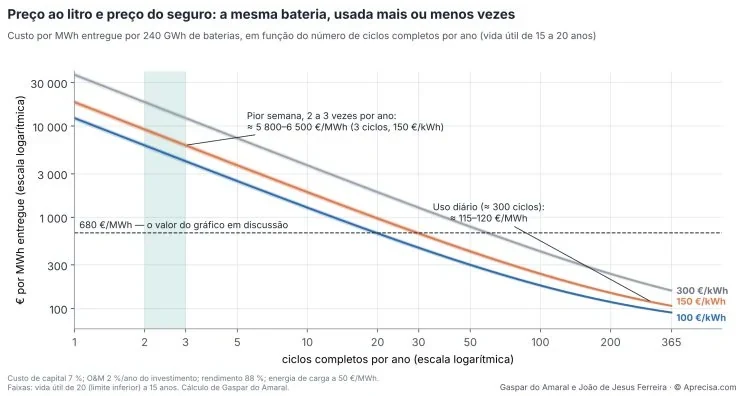
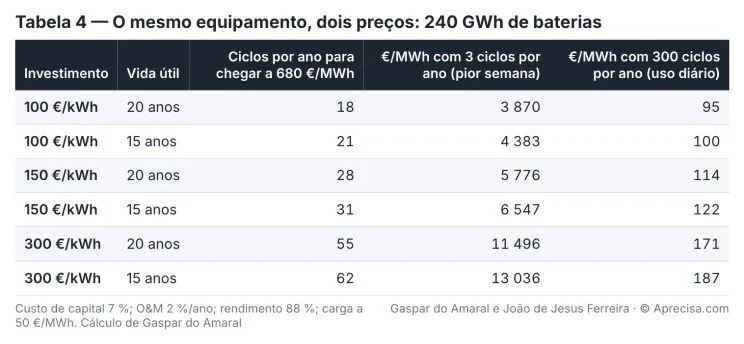
Figure 1 shows the cost per MWh delivered by 240 GWh of batteries as a function of the number of full cycles per year, for three investment levels (100, 150 and 300 €/kWh) and service lives of 15 to 20 years. Both scales are logarithmic, and the relationship is almost a straight descending line: every time the number of cycles is multiplied by ten, the cost per MWh is divided by roughly ten. Used every day, the 150 €/kWh battery delivers energy at about 115–120 €/MWh. Kept for three lulls a year, it delivers it at about 5,800–6,500 €/MWh. The dashed line marks the 680 €/MWh of the chart under discussion: to get there, the battery would have to do between 18 and 62 full cycles a year, depending on the investment. The green band marks the service of the worst week. The figure says just one thing: the price per MWh of a storage installation is not a property of the technology, it is a property of its use.
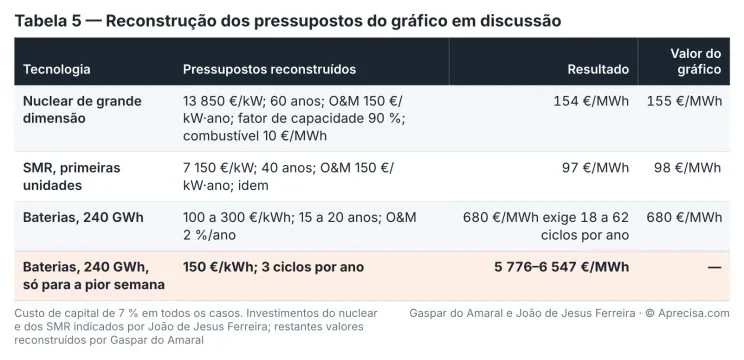
The value of 680 €/MWh is therefore favourable to batteries in the scenario in which it was used. It assumes ten to twenty times more use than three lulls a year allow. We reconstructed the other assumptions of the chart with a cost of capital of 7% and reproduced them with an error of 1 €/MWh (Table 5, in the methodological note). The chart is consistent for nuclear and for the SMR. For batteries, it measures the price per litre of an installation that, in the worst-week scenario, only serves as insurance.
How an investment turns into a cost per year. Someone who buys a house with a mortgage does not pay the price all at once: they pay an instalment over many years, with the interest included. The same happens with the equipment of the electricity system. A loan of 100,000 € at 7% a year, repaid over 25 years, costs an instalment of about 8,580 € a year, that is, 8.58% of the amount borrowed. That percentage is called the capital recovery factor, and it depends on only two things: the interest rate and the term. With the 7% used in this article, it is 10.98% over 15 years, 9.44% over 20 years, 8.58% over 25 years and 7.25% over 50 years. The longer the term, the lower the instalment, but never below the 7% of the interest.
The annual cost of each solution then adds up three items that any car owner knows: the instalment on the car loan; maintenance — the service and the insurance —, which is paid whether the car is driven or not; and fuel, which is only paid when you drive. All the calculations in this article follow this recipe.
In practice: A hospital generator stands idle all year. Nobody chooses it for the price of the kWh, but for the cost of having it ready on the day the grid fails. For the worst week, the right question is not how much each MWh costs, but how much it costs, per year, to have the MWh available when they are needed.
III. The scenario: 240 GWh, three times a year
We kept the scenario of the original chart: a deficit of 2 GW for 120 hours in a row, that is, 240 GWh per lull, and three lulls a year, the upper limit of the scenario’s “two to three”. As the calculation is linear, a deficit of 4 GW doubles all the costs that follow.
The scenario is deliberately simplified and is not a forecast. In an adequacy study, the deficit results from the chronological simulation of hourly series of generation and consumption, with the availability of power stations, hydro storage, network constraints, interconnections and weather variability, and is expressed in internationally recognised indicators: LOLE (loss of load expectation, expected hours of shortfall per year), EENS (expected energy not served) and ELCC (effective load carrying capability, the effective contribution of each resource to adequacy). The comparison that follows is a reference techno-economic exercise; it does not replace that study.
A measured order of magnitude helps to place the scenario. In the ENTSO-E hourly data from 2015 to 2026, the worst five-day window of each year took between 116 and 158 GWh of wind output away from the Portuguese system compared with that year’s average. The 240 GWh of the scenario are above anything the wind has ever failed to produce in a measured year: the scenario is demanding, not optimistic.
To cover the 240 GWh we considered four solutions. Table 1 brings together the assumptions of each one.
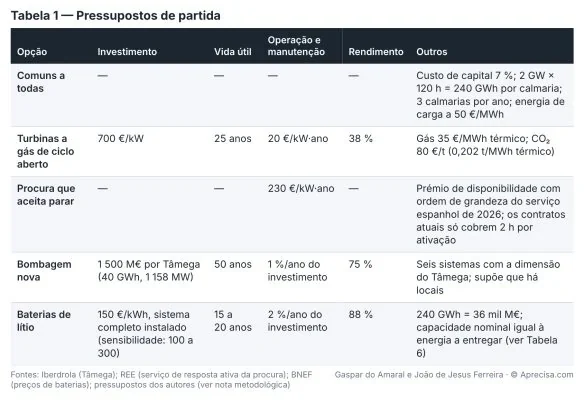
How to read Table 1: Each row says how much it costs to buy, maintain and run a solution. Some numbers make sense with a simple translation.
- 2 GW for 120 hours. The country consumed 53.1 TWh in 2025; divided by the 8,760 hours of the year, that gives an average of about 6.1 GW at every instant. The 2 GW are therefore about a third of the country’s average consumption. Over 120 hours, five days, they add up to 2 GW × 120 h = 240 GWh: what 80,000 families using 3,000 kWh spend in a whole year, or what the whole country consumes in about 40 hours.
- Investment per kW or per kWh. Turbines are paid for by power — the size of the engine: 700 €/kW × 2,000,000 kW = 1,400 M€. Batteries are paid for by the energy stored — the size of the tank: 150 €/kWh × 240,000,000 kWh = 36,000 M€. This is where the difference between the two is born: a turbine has an engine and takes its fuel from the gas pipeline; a battery has to have the whole tank bought, full and waiting.
- Efficiency. It is the part of the energy left at the end. A turbine with 38% turns 100 MWh of gas into 38 MWh of electricity; the rest goes as heat, as in a car engine. To deliver 1 MWh, it burns 1 ÷ 0.38 = 2.63 MWh of gas. A battery with 88% has to receive 100 ÷ 0.88 = 114 MWh to give back 100; pumped storage, with 75%, has to receive 133.
- Gas, CO₂ and charging energy. Gas costs 35 € per thermal MWh, and each MWh of gas burnt emits 0.202 t of CO₂, paid at 80 €/t. The energy to charge batteries and pump water is bought at 50 €/MWh, in the hours of surplus.
Two assumptions deserve a note. The first is that of batteries. The investment of 150 €/kWh refers to a complete installed system and corresponds, roughly, to the most recent European average: the BloombergNEF survey of December 2025 gave 177 US$/kWh in Europe (about 150 €/kWh), a world average of 117 US$/kWh and 73 US$/kWh in China. Prices have fallen fast — a year earlier, the European average was 275 US$/kWh —, and Table 6 tests 100 and 75 €/kWh. The 240 GWh are the energy to be delivered, and it is assumed, for simplicity, that all the nominal capacity is usable. The efficiency of 88% covers the cycle losses, not oversizing: a project would have to add depth of discharge, degradation over its life and the limits of the converters. With a usable discharge of 90% and 80% of capacity at the end of life, about 333 GWh nominal would be needed, and the annual cost would rise to 5,761 to 6,531 M€. The simplification therefore favours batteries.
The second is that of pumped storage, which deserves an additional caveat. The Sistema Eletroprodutor do Tâmega (the Tâmega hydroelectric complex) — 1,158 MW, 40 GWh, more than 1,500 M€ — combines conventional and reversible hydroelectric generation, dams and reservoirs; its overall investment is not the cost of a stand-alone pumped storage plant. Six equivalent schemes give an order of magnitude for 240 GWh, not an optimised sizing for 2 GW over 120 hours. And building them depends on suitable sites, on environmental and hydrological conditions and on the ability to replenish the stored energy. The pumped-storage results are therefore indicative and require their own techno-economic assessment.
IV. Four ways of insuring the worst week
With the assumptions of Table 1 and the recipe of instalment, maintenance and fuel, the calculation for each solution can be done by hand, in a few lines. We follow it step by step, so that each number in Table 2 appears already explained.
1. Standby gas turbines
Buying 2 GW of turbines at 700 €/kW costs 1,400 M€. Repaid over 25 years at 7%, the instalment is 8.58% of that amount: 120 M€ a year. Maintenance, 20 €/kW a year, adds 40 M€. Just to have the turbines ready, standing idle and waiting, the country pays 160 M€ a year. It is the gym membership: you pay whether you go or not.
When the lull arrives, fuel comes in. Each MWh of electricity burns 2.63 MWh of gas, which at 35 €/MWh costs 92.1 €. That gas emits 2.63 × 0.202 = 0.53 t of CO₂, which at 80 €/t costs 42.5 €. Each MWh delivered therefore costs 134.6 € in fuel and allowances. A lull of 240,000 MWh costs 240,000 × 134.6 € = 32.3 M€; three lulls, 96.9 M€.
Annual cost: 160 + 97 = 257 M€.
2. Demand that agrees to stop
Here there is nothing to buy: large consumers are paid to be ready to stop. It is insurance in reverse, in which whoever accepts the inconvenience receives the premium. The reference price comes from the Spanish active demand response service: on average, 53.8 € per MW and per hour of availability in 2026. Paid for about 4,300 hours a year, that gives 53.8 × 4,300 ≈ 231,000 € per MW, that is, about 230 €/kW a year. For 2 GW: 230 € × 2,000,000 kW = 460 M€ a year. There is no fuel and no charging: the energy the factory stops consuming is left for everyone else.
Annual cost: 460 M€. The cost this calculation does not see is the output the factory loses in five days at a standstill, and no market has yet revealed that one.
3. New pumped storage
A reservoir with pumping is a water battery: in the hours of surplus, it pumps water uphill; in the lull, it lets it fall through the turbines. Tâmega stores 40 GWh and cost more than 1,500 M€; 240 GWh need six of them, that is, 6 × 1,500 = 9,000 M€. As dams last a long time, it is repaid over 50 years, with an instalment of 7.25%: 652 M€ a year. Maintenance, 1% of the investment, adds 90 M€. To deliver 720,000 MWh a year — three lulls of 240,000 —, with an efficiency of 75%, 720,000 ÷ 0.75 = 960,000 MWh must be pumped, which at 50 €/MWh costs 48 M€.
Annual cost: 652 + 90 + 48 = 790 M€.
4. Lithium batteries
Batteries are paid for by the size of the tank: 36,000 M€, almost 26 times the price of the turbines. Repaid over 20 years, the instalment is 9.44%: 3,398 M€ a year; if they last only 15 years, 10.98%: 3,953 M€. Maintenance, 2% a year, adds 720 M€. To deliver 720,000 MWh with an efficiency of 88%, 720,000 ÷ 0.88 = 818,182 MWh must be charged, which at 50 €/MWh costs 40.9 M€.
Annual cost: 3,398 + 720 + 41 = 4,159 M€ with a 20-year life; 3,953 + 720 + 41 = 4,714 M€ with 15. Charging energy weighs only 1% of the total. Almost everything is instalment and maintenance of a tank that spends the year full and idle.
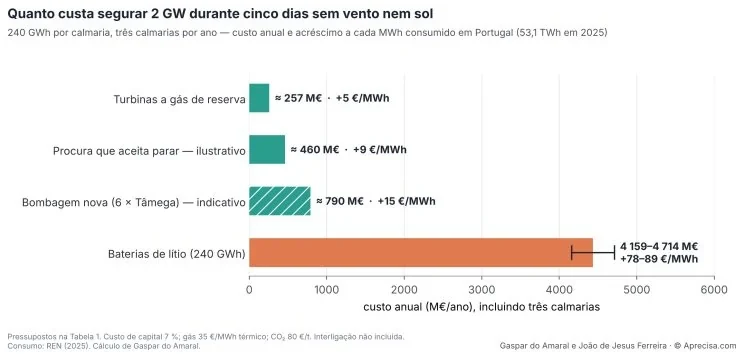
Figure 2 compares the annual cost of the four solutions, with the three lulls already included, and, next to each bar, the surcharge that this cost would represent on every MWh consumed in Portugal (53.1 TWh in 2025). Standby gas turbines cost about 257 M€ a year: 160 M€ to have them ready and about 32 M€ of gas and CO₂ per lull. Demand that agrees to stop has an illustrative cost of 460 M€, calculated with the availability premium adopted; it is not a demonstrated market cost for a continuous interruption of 120 hours, whose technical feasibility and economic consequences remain to be assessed. New pumped storage, six Tâmegas, would cost about 790 M€, an indicative value. Batteries cost 4,159 to 4,714 M€ a year — sixteen to eighteen times the turbines. The figure shows that choosing the solution for the worst week is not a matter of fine-tuning: there is an order of magnitude between the cheapest solution and the most expensive.
The result shows the weight of the duration of the shortage: when the deficit lasts for days, the solutions whose investment grows with the energy stored cost much more than dispatchable capacity. It is not, however, an assessment of the most economic mix for Portugal. Keeping available a power station that already exists does not cost the same as building a new one: ERSE estimates the annual cost of keeping an existing combined cycle at 18.2 €/kW·year, against 74.8 €/kW·year for a new open-cycle turbine. With the current combined cycles acting as reserve, the annual cost of the worst week would fall from 257 to about 103 M€ (Table 6). The most efficient solution must come from an integrated analysis of the existing fleet, future capacity needs and the operating conditions of each technology.
From the cost to the country to the cost to each home
The annual cost answers one question: how much the country pays. Table 2 answers four more, and each answer comes from a single division or multiplication. We follow the turbines row; the others are done in the same way.
- How much does each MWh saved in the lull cost? The annual cost is divided by the energy delivered in the three lulls: 257.1 M€ ÷ 720,000 MWh = 357 €/MWh. It is like dividing the annual cost of a hospital generator by the few hours it works: the result is high because the equipment is almost always idle. For the other solutions: 460 ÷ 0.72 = 639 €; 790 ÷ 0.72 = 1,097 €; and, for batteries, 4,159 ÷ 0.72 = 5,776 € to 4,714 ÷ 0.72 = 6,547 € per MWh.
- How much does it weigh on each MWh consumed in the country? The cost is spread over all consumption, like the lift costs in a block of flats, divided among all the flats: 257.1 M€ ÷ 53.1 million MWh = 4.84 € more per MWh. Demand that agrees to stop, 8.66 €; pumped storage, 14.88 €; batteries, 78.32 to 88.77 €.
- How much does a family pay? A family that uses 3,000 kWh, or 3 MWh a year, pays 3 × 4.84 = 14.52 € a year, that is, 14.52 ÷ 12 = 1.21 € a month. With batteries, 3 × 78.32 ÷ 12 = 19.58 € to 3 × 88.77 ÷ 12 = 22.19 € a month.
- How much does a factory pay? A factory that uses 10 GWh, or 10,000 MWh a year, pays 10,000 × 4.84 € = 48,400 € a year. With batteries, 783 to 888 thousand €.
Table 2 brings together the numbers we have just obtained.
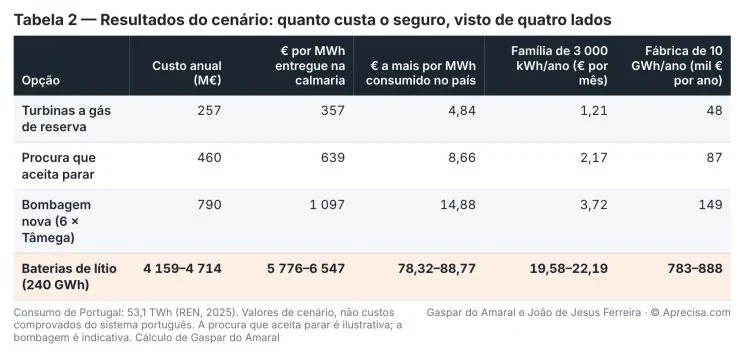
How to read Table 2: Each row is the same calculation, done for one solution. The first column is the annual cost, calculated above. The others are obtained from it: dividing by 720,000 MWh gives the cost of each MWh saved in the lull; dividing by 53.1 million MWh gives the surcharge on each MWh consumed in the country; that surcharge × 3 MWh ÷ 12 gives the family, per month; × 10,000 MWh gives the factory, per year. For batteries, each number is 16 to 18 times that of the turbines, because 4,159 ÷ 257 = 16.2 and 4,714 ÷ 257 = 18.3.
The €/MWh values in the second column spread the annual cost over the energy delivered in the three lulls. They are indicators of the reserve service analysed, not levelised costs of generation, and cannot be compared directly with the LCOE of any technology. The MWh delivered in the worst week costs about 360 € with standby turbines and 5,800 to 6,500 € with batteries; the 50 to 100 €/MWh of wind or solar measure something else — the price of energy, not the price of insurance. All the values in the table are scenario results, not proven costs of the Portuguese system.
Turbines are the cheapest solution even with expensive fuel. With gas at 70 €/MWh thermal, double the assumption, each MWh delivered costs (70 + 80 × 0.202) ÷ 0.38 = 226.7 € in fuel and allowances, instead of 134.6 €; the three lulls cost 163 M€ instead of 97, and the annual cost rises to 160 + 163 = 323 M€. With CO₂ also at 120 €/t, (70 + 120 × 0.202) ÷ 0.38 = 248.0 €/MWh, 179 M€ a year in fuel and a total of 339 M€. Even with fuel almost doubling, turbines still cost less than a tenth of batteries, because fuel is only paid for 360 hours a year. Even when several assumptions are changed at the same time against turbines and in favour of batteries, the gap shrinks but does not reverse: 5.8 times in an unfavourable combination and 3.3 times in an extreme combination (Table 6, in the methodological note). The reason is structural: the cost of a standby turbine lies almost entirely in power, which is cheap, and little in energy, which is only paid for when used. For batteries, the cost lies entirely in the energy stored, which is paid for whether it is used or not.
V. On the bill of a family and of a factory
Millions per year are hard to feel. Divided by the country’s consumption, they become concrete. A family that consumes 3,000 kWh a year — within the 2,500 to 5,000 kWh band, the most representative in Portugal — pays about 690 € a year: 3,000 kWh × 0.23 €/kWh, the reference price including taxes published by ERSE. It is against these 690 € that the surcharges calculated in the previous chapter are measured.
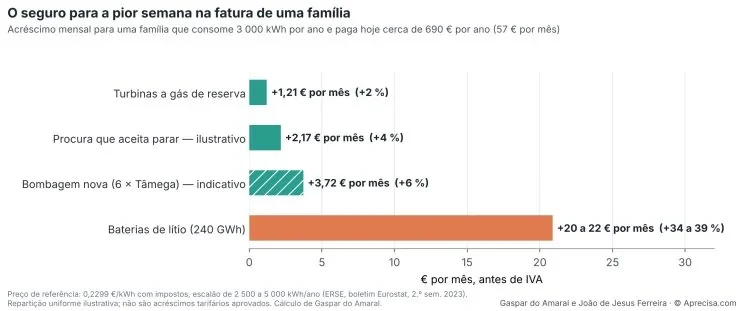
Figure 3 shows the monthly surcharge that each solution would represent for that family, if the cost of the insurance were spread over all consumption. With standby turbines, 1.21 € a month: 14.52 € a year, or 14.52 ÷ 690 = 2.1% of the bill. With demand that agrees to stop, 2.17 € a month (3.8%). With new pumped storage, 3.72 € (6.5%). With batteries, 19.58 to 22.19 € a month: 235 to 266 € a year, or 34 to 39% of the bill. For a factory that consumes 10 GWh a year, the difference goes from 48 thousand € to 783 to 888 thousand € a year. The figure translates the same order of magnitude as Figure 2 into a unit everyone recognises: euros per month.
These surcharges assume that the annual cost is spread evenly over all national consumption. They are an illustrative translation of the size of the charges, not a tariff forecast nor approved tariff increases: the actual pass-through depends on the financing mechanisms, the tariff structure, the allocation to the different agents and regulatory decisions.
A note of rigour. Compared with the energy component alone, which is around 50 to 70 €/MWh, battery insurance increases the cost by 110 to 180% (78.32 ÷ 70 = 112%; 88.77 ÷ 50 = 178%); compared with the family’s full bill, which includes networks, levies and taxes, by 34 to 39%. Both statements are true, and they should not be confused. In either reading, and for any energy price between 40 and 90 €/MWh, turbines add less than 15% (4.84 ÷ 40 = 12%), and batteries never less than about 85% (78.32 ÷ 90 = 87%).
In practice: Having gas turbines waiting for the five worst days of the year costs a family little more than 1 € a month, the price of a coffee. Doing the same with batteries costs about 20 € a month, the price of a dinner out. The difference is not in the efficiency of the machines: it is in paying for an engine or paying for a full tank.
VI. Where each insurance can fail
Cost is not the only criterion. Insurance that fails on the day it is needed is not worth what it costs. In critical systems engineering, the first question is whether the reserve can fail at the same time as what it protects — common-mode failure. The second is whether it depends on a single point of failure. The third, today, is whether it can be switched off remotely by someone who should not be able to.
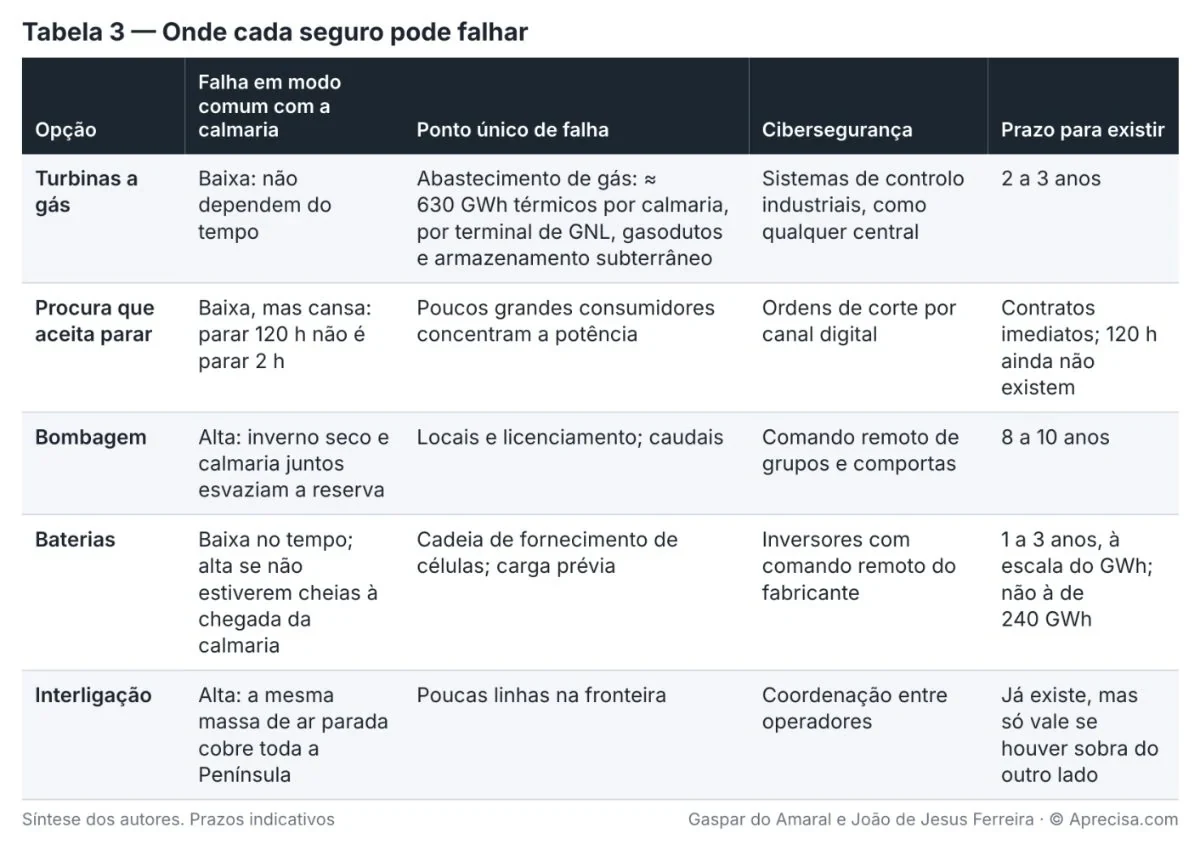
Table 3 summarises the analysis. Three points deserve development.
Water and wind can fail together. A dry winter with a lull is the worst case for pumped storage: the hydro reserve shrinks exactly when it is needed. A third colleague, in the same conversation, recalled the rational behaviour of operators: with reservoirs low, water is worth the price it will have in the future, and turbines are only run in earnest when prices are high. This is the so-called water value, and it is what pumped storage exists for. But it means that pumped storage is only insurance if the reservoirs have something to run through the turbines. The worst week has to be calculated with the real storage levels, reservoir by reservoir.
Interconnection is not firm capacity. Its contribution depends on there being generation available on the other side and transmission capacity at the critical moments. An anticyclone can cover the whole Peninsula and reduce the variable output of both countries at the same time; Portugal will continue to import if Spain has enough firm capacity, water or imports from France. Today it is, in fact, Spain that holds up the Portuguese lulls: the hours with net imports above 3 GW went from one in 2015 to 1,562 in 2026, up to 13 October. But it is not technically correct to treat the nominal interconnection capacity as guaranteed power. For planning purposes, its contribution is assessed under simultaneous scarcity, with the adequacy of the neighbouring system, transmission constraints and operational security criteria. Interconnection integrates markets and strengthens security, but it does not do away with national firm capacity, and that is why it does not enter this calculation as a solution in its own right.
Turbines shift the risk to gas. Each lull consumes about 630 GWh of natural gas: 240 GWh ÷ 0.38 = 632 GWh thermal, close to 60 million m³, at about 10.5 kWh per m³. The single point of failure becomes supply: the liquefied natural gas terminal, gas pipelines and underground storage. It is a manageable risk — the gas system already exists and already has security reserves —, but it has to be guaranteed by contract and by regulation, not by assumption.
In cybersecurity, the question common to batteries and photovoltaic generation is the remote control of inverters. The ability to modulate or switch off remotely should belong to the grid operator, not to the equipment manufacturer.
VII. What this calculation leaves out
- 1. The real deficit. The 2 GW and the three lulls are the scenario under discussion, not a measurement. The worst five-day window measured between 2015 and 2026 took 116 to 158 GWh of wind away from the system; the system deficit also depends on water, gas, the interconnection and demand on that day, and only an adequacy study determines it.
- 2. What already exists. The combined-cycle power stations that exist today already pay part of the insurance. Kept available, the annual cost of the worst week falls to about 103 M€ (Table 6).
- 3. 120-hour demand. Current interruptibility contracts cover two hours per activation. Asking a factory to stop for five days has a cost in lost output that no market has yet revealed. The 460 M€ are illustrative.
- 4. Integration costs. A system with a lot of wind and solar has costs that the LCOE does not show: surpluses on days of plenty, very low or negative prices, curtailment and additional investment in storage, networks and system services. These costs are part of the overall cost of the system and must be included in the assessment of new investments in variable generation. Additional installed capacity, on its own, guarantees neither greater security of supply nor lower costs for consumers.
- 5. Emissions. Turbines emit about 130 thousand tonnes of CO₂ per lull — 632 GWh of gas × 0.202 t/MWh = 128 thousand t —, whose cost is included at 80 €/t: 10.2 M€ per lull. To give an order of magnitude, that is what about 70,000 cars doing 15,000 km at 120 g/km emit in a year. Anyone who considers that price low can redo the calculation: even at 120 €/t, the order of magnitude stays the same.
- 6. Networks and system services. Integrating the different technologies has different costs of connection, network reinforcement, voltage control, frequency regulation, operating reserves and dynamic stability. They are not the same for all solutions, and leaving them out is a limitation of this comparison: a complete assessment has to add up the incremental integration charges of each one, without omitting them or shifting them to other components of the system.
- 7. Who bears the costs — the causer-pays principle. Storage, firm capacity, operating reserves and network reinforcements are resources with a cost, which end up being recovered through markets, tariffs or other financing mechanisms. It is important to distinguish the charges that respond to general security-of-supply needs from those that result specifically from integrating particular technologies. Whenever a technically and economically grounded causal relationship can be established, the allocation of these charges should respect the causer-pays principle, avoiding their indiscriminate socialisation among consumers. This article quantifies the cost of the insurance, not the share that each technology causes; establishing that is the next step, and it requires transparency in how costs are formed and in the mechanisms for recovering them.
Conclusion
An electricity system with a lot of wind and solar pays two bills: the bill for everyday energy and the bill for the insurance for the worst week. Charts of costs per MWh measure the first well and the second badly, because the price per MWh of a reserve installation depends on how often it is used, and insurance, by definition, is used little.
Measured with the right ruler — the annual cost of having 240 GWh available three times a year —, the result is clear. For five days, standby gas turbines are the cheapest solution, with an order-of-magnitude advantage over batteries, even with expensive gas and CO₂; keeping the combined cycles that already exist, the advantage is even greater. Demand that agrees to stop and pumped storage sit between the two, but with serious caveats: the first does not yet exist at the five-day scale; the second fails precisely in dry winters. Batteries remain excellent for what they were made for — hours, frequency, the late-afternoon peak. For the worst week, they are the most expensive insurance.
The planning challenge is therefore not to maximise the penetration of one technology, but to build a system capable of meeting demand permanently, with security, reliability and competitiveness. The expansion of variable generation should be assessed by its effective contribution and by the costs it entails in firm capacity, storage, networks, flexibility and system services: installed capacity far above the peak does not, on its own, guarantee the adequacy of the system.
The decisive criterion is the overall cost of supplying electricity when and where it is needed, and not just the cost of producing it when the weather helps. That requires bringing back integrated planning of demand and supply and treating security of supply as a condition of the system, and not as an externality of the energy transition.
The question is at the same time technical, economic and political: what electricity system do we want to build, how much are we willing to pay to guarantee security of supply, and who should bear the additional costs of energy policy choices? Without an answer to these three questions, we will hardly have an electricity system that is at once secure, sustainable and competitive.
In one sentence: Guaranteeing the five worst days of the year with gas turbines costs a family little more than 1 € a month; with batteries, about 20 €.
Gaspar do Amaral and João de Jesus Ferreira
Text by the two authors. Tables, figures and calculations by Gaspar do Amaral, AI-assisted in research and verification. © Aprecisa.com
Methodological note
All the values in the article come from a single set of calculations, with the assumptions of Table 1. The annual cost of each solution is the sum of the annuity of the investment, operation and maintenance, and the energy used in the lulls:

where I is the investment, r = 7% the cost of capital, n the service life, f operation and maintenance as a fraction of the investment, N = 3 the number of lulls per year, E = 240 GWh the energy per lull, η the efficiency and p (charging) = 50 €/MWh the price of charging energy. The factor in square brackets, without f, is the capital recovery factor: 0.1098 for 15 years, 0.0944 for 20, 0.0858 for 25 and 0.0725 for 50. The cost per MWh delivered and the surcharge per MWh consumed are:

Gas turbines. 700 €/kW × 0.0858 + 20 €/kW·year = 80.1 €/kW·year; for 2 GW, 160.1 M€/year. Variable cost: 35 / 0.38 = 92.1 €/MWh of gas and 80 × 0.202 / 0.38 = 42.5 €/MWh of CO₂, total 134.6 €/MWh. Per lull, 240,000 MWh × 134.6 €/MWh = 32.3 M€; with three, 96.9 M€. Total: 257.1 M€/year. Gas per lull: 240 GWh / 0.38 = 632 GWh thermal; CO₂: 632 GWh × 0.202 t/MWh ≈ 128 thousand t, rounded in the text to about 130 thousand t. The fixed cost of 80.1 €/kW·year is close to the CONE of 74.8 €/kW·year that ERSE estimates for a new open-cycle turbine.
Existing combined cycles. 2 GW × 18.2 €/kW·year (ERSE’s CONE for keeping an existing combined cycle) = 36.4 M€/year. Variable cost with an efficiency of 55%: 35 / 0.55 + 80 × 0.202 / 0.55 = 93.0 €/MWh; with three lulls, 66.9 M€. Total: about 103 M€/year. With the 38% efficiency of the turbines, it would be about 133 M€/year.
Demand that agrees to stop. 2 GW × 230 €/kW·year = 460 M€/year. The Spanish active demand response service was awarded at 65 €/MW per allocated hour in the first half of 2026 and at 42.62 €/MW in the second, an average of 53.8 €/MW. The 230 €/kW·year correspond to paying that price for about 4,300 hours a year; the number of hours actually allocated is not public in the sources consulted, so the value is an assumption of the authors. Each activation is limited to two hours.
Pumped storage. Six systems of 1,500 M€: 9,000 M€ × (0.0725 + 0.01) = 742.1 M€/year; charging energy 3 × 240 GWh / 0.75 × 50 €/MWh = 48.0 M€. Total: 790.1 M€/year. The reference investment is the overall cost of a complex hydroelectric scheme, not the specific cost of reversible capacity; the result is an indicative approximation and not a validated cost for 240 GWh of usable pumped storage in Portugal.
Batteries. 240 GWh × 150 €/kWh = 36,000 M€. With 20 years, 36,000 × (0.0944 + 0.02) = 4,118 M€; with 15 years, 4,673 M€. Charging energy: 3 × 240 GWh / 0.88 × 50 €/MWh = 40.9 M€. Total: 4,159 to 4,714 M€/year. Table 4 shows the sensitivity to the investment and to the number of cycles.
How each row of Table 4 is obtained. Example: 150 €/kWh and 20 years. The fixed part — instalment and maintenance — is 4,118 M€ a year, and each MWh delivered also costs 50 ÷ 0.88 = 56.8 € of charging. With 3 cycles a year, 720,000 MWh, the fixed part per MWh is 4,118 M€ ÷ 720,000 = 5,719 €; adding the charging, 5,776 €/MWh. With 300 cycles — filling and emptying almost every day —, the energy delivered is a hundred times greater, 72 million MWh, and the fixed part per MWh falls to 57 €: total, 114 €/MWh. To reach the 680 €/MWh of the chart under discussion, 680 − 56.8 = 623.2 € per MWh are left to pay the fixed part; 4,118 M€ ÷ 623.2 € = 6.61 million MWh a year, that is, 6.61 TWh ÷ 0.24 TWh = 27.5 cycles. It is like a long-term rental car: the price per kilometre depends on how many kilometres are driven a year.
Sizing the storage. The previous values assume a nominal capacity equal to the energy to be delivered. A project has to consider separately the usable capacity, the admissible depth of discharge, degradation, conversion efficiencies and converter power. With a usable discharge of 90% and 80% of capacity at the end of life, the nominal capacity is 240 / (0.9 × 0.8) ≈ 333 GWh, and the annual cost becomes 5,761 to 6,531 M€. Guaranteeing 120 hours also requires the energy to be stored before the episode: physical capacity is not enough.
Reconstruction of the chart under discussion. Levelised cost = (investment × recovery factor + operation and maintenance) / (8,760 h × capacity factor) + fuel. For large nuclear, (13,850 × 0.0712 + 150) / 7.884 MWh/kW + 10 = 154 €/MWh, with 60 years. For the SMR, (7,150 × 0.0750 + 150) / 7.884 + 10 = 97 €/MWh, with 40 years. For batteries, the number of cycles that makes the cost equal to 680 €/MWh is obtained by solving the second formula for N.
Bill. Surcharge per MWh consumed = annual cost / 53.1 TWh. Family: × 3 MWh/year; percentage relative to 3,000 kWh × 0.2299 €/kWh = 690 €/year. Factory: × 10,000 MWh/year. It is a uniform and illustrative allocation; the values do not include VAT on the surcharge.
Limits and sensitivity. The assumptions are illustrative and are intended to compare orders of magnitude in a defined scenario. They do not replace an adequacy study with chronological series of generation and consumption, resource availability, weather conditions, network constraints and probabilistic analysis. Table 6 changes several assumptions at the same time: the investment and cost of capital of the turbines, gas and CO₂ prices, the investment, cost of capital and life of the batteries, sizing by nominal capacity and the use of existing combined cycles. The order between the gas reserve and batteries holds in all cases, with ratios between 3.3 and 46. The power of the deficit enters both solutions linearly and does not change the ratio; fewer episodes per year or longer episodes increase it. Only short deficits, of a few hours, reverse the order — and that is what batteries are for. The economic values are conditional on the assumptions adopted and do not determine the costs or the optimal configuration of the Portuguese electricity system.
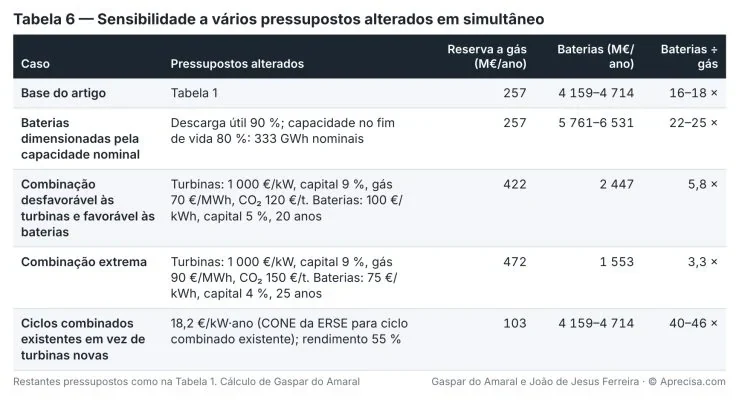
How each row of Table 6 is obtained. In the unfavourable combination, the turbines cost 1,000 €/kW, with 9% capital: 2,000 M€ × 10.18% = 204 M€ of instalment, plus 40 M€ of maintenance, 244 M€; fuel becomes (70 + 120 × 0.202) ÷ 0.38 = 248.0 €/MWh, that is, 179 M€ in the three lulls; total, 422 M€. The batteries cost 100 €/kWh, with 5% capital and 20 years: 24,000 M€ × (8.02% + 2%) = 2,406 M€, plus 41 M€ of charging, 2,447 M€. Ratio: 2,447 ÷ 422 = 5.8. In the extreme combination, the turbines add up to 244 M€ fixed and (90 + 150 × 0.202) ÷ 0.38 = 316.6 €/MWh, 228 M€ of fuel: 472 M€. The batteries, at 75 €/kWh, with 4% and 25 years: 18,000 M€ × (6.40% + 2%) + 41 = 1,553 M€. Ratio: 3.3. With the nominal capacity of 333 GWh, the battery investment becomes 50,000 M€ and the annual cost 5,761 to 6,531 M€: 22 to 25 times the turbines. With the existing combined cycles, 2 GW × 18.2 €/kW = 36.4 M€ of fixed cost and (35 + 80 × 0.202) ÷ 0.55 = 93.0 €/MWh, 67 M€ of fuel: 103 M€, and batteries come to cost 40 to 46 times more.
Annotated references
A. Iberian electricity system
- ECO (2026), Consumo de energia elétrica atinge máximo histórico em 2025, citing REN — 53.1 TWh consumed in Portugal in 2025.
- ENTSO-E, Transparency Platform — consumption, hourly wind output, installed capacity and Portugal–Spain physical flows, 2015 to 13 October 2026; basis of the measured values (116–158 GWh; hours of imports above 3 GW).
- ERSE (2025), Segurança de Abastecimento — final report of December 2025: CONE of 18.2 €/kW·year for an existing combined cycle and of 74.8 €/kW·year for a new open-cycle turbine; VoLL of 12,433 €/MWh.
- Red Eléctrica (2026), press release on the auction of the active demand response service — 1,775 MW at 42.62 €/MW per hour, second half of 2026; maximum of two hours per activation.
- Energías Renovables (2025), SRAD — 1,725 MW at 65 €/MW per hour, first half of 2026.
- Energías Renovables (2026), new activation of the SRAD — 28 September 2026, 943 MW, 1,634.5 MWh, wind below forecast; nine activations in the year.
B. Storage
- Iberdrola (2022), Iberdrola inaugura a gigabateria do Tâmega — 1,158 MW, 40 GWh, investment of more than 1,500 M€.
- Energy-Storage.news (2025), Battery storage system prices continue to fall sharply, BNEF and Ember reports find — BloombergNEF survey of 10 December 2025, turnkey systems: world average of 117 US$/kWh; Europe 177; United States 219; China 73.
- Energy-Storage.news (2024), Behind the numbers: BNEF finds 40% year-on-year drop in BESS costs — 2024 survey: Europe 275 US$/kWh.
C. Consumer prices
- ERSE (2024), Boletim Eletricidade Eurostat, 2nd half of 2023 — 0.2299 €/kWh including taxes in the 2,500 to 5,000 kWh/year household band.
D. Adequacy methods
- ENTSO-E, ERAA 2025 — European resource adequacy assessment; definitions of LOLE and EENS and chronological simulation with several climate years.
- ACER, Decision 23/2020 — methodology for calculating VoLL, CONE and the reliability standard.
Gaspar do Amaral and João de Jesus Ferreira · © Aprecisa.com
Methodological note
What this page is. A translation of the article by Gaspar do Amaral and João de Jesus Ferreira published on LinkedIn on 15 October 2026; the full Portuguese version is on this site. The authors’ own methodological note and annotated references are translated above, in the place they occupy in the original.
Numbers and units. All numbers, units and calculations are exactly those of the original; only the decimal and thousands separators follow British usage (1,634.5 instead of 1 634,5). Monetary amounts keep the original notation (M€ = million euros).
Changes of form, not of content. The original subtitle (“… — e porque é que a resposta não está no preço por MWh”) appears as the subtitle of this page. The eleven original images (Figures 1 to 3, Tables 1 to 6 and the two formulas) are reproduced as they are, with their texts in Portuguese; each caption translates the content of the image. The titles of the sources stay in their original language; the links are those of the original.
The discussion is on LinkedIn (in Portuguese)
Comments on this text are made on LinkedIn, where the article was shared in Portuguese. You are welcome to write in English. Agree, disagree or add data: every well-founded objection receives a reply.
Gaspar do Amaral · Original in Portuguese of 15 October 2026, published on this site; translation issued on 27 October 2026 · Figures and tables © Aprecisa.com · AI-assisted