 ← Grupo Aprecisa · Connecting those who know with those who need
Resilience · Newsletter “A Porta Estreita” (The Narrow Door) · Episode 3
Day 228: The domino effect
Today’s shock only reaches the supermarket months from now
Gaspar do Amaral · 14 October 2026
Translated from the Portuguese original. This version was issued on 27 October 2026.
On this site, this article has been
Episode 3 of the series “A Porta Estreita” (The Narrow Door). The Hormuz shock began 228 days ago. Oil felt it within hours. Your shopping basket is feeling it now. And the heaviest part may not have arrived yet. Not out of pessimism, but because of the way supply chains work.
Before you read on, answer off the top of your head: since February, diesel has become 31% more expensive. How much do you think the basket of 63 essential goods tracked by DECO (the Portuguese consumer association) rose over the same period? Keep the number in mind. The answer is halfway through the article and it will surprise you.
Monday, eight in the morning. A lorry overturns on the motorway, at the entrance to the city.
By half past eight, the GNR (Portugal’s national guard, which polices the roads) has already cleared the lanes. The accident is over.
At half past nine, Mr António leaves home, twenty kilometres away, and gets stuck at the roundabout on his street. He looks at his phone: no accident reported in the area. He cannot understand why.
The cause disappeared an hour ago. The effect is only now reaching his door.
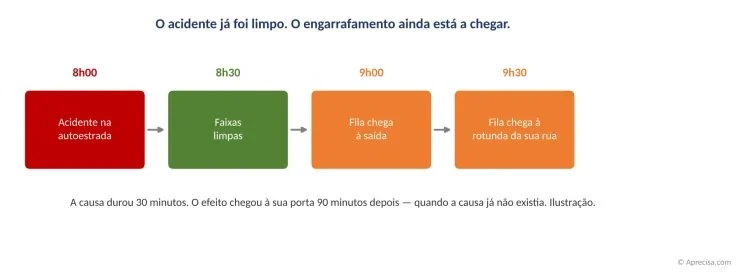
The figure reads from left to right, like a clock. The red box is the cause, and it has already disappeared by the time the orange boxes, the effects, reach your street. Anyone who only looks at the roundabout never sees the accident. Anyone who only looks at the accident thinks the problem is already over.
This is the domino effect. And it is the reason why almost everyone looks in the wrong place.
The shock you see in the news today is the accident. What you will pay at the supermarket is the queue. And the queue is still on its way.
Today, day 228
Today, 14 October, is day 228. The latest count published by PortWatch, the maritime traffic monitor of the International Monetary Fund (IMF), is still the one from 4 October: 4 crossings, against 85 a day before the crisis, about 5% of normal. No new count has come out for ten days. In a monitor that counts ships by the signal they themselves transmit, silence is also a piece of data: many ships are sailing with their signal switched off.
Yesterday, a tanker and a container ship were hit by projectiles of unknown origin in the strait. This morning, according to UKMTO, the British maritime trade operations centre, quoted by the trade press, two more ships were hit. On 11 October, a drone hit the tanker Petro Dolphin and two Indian sailors are missing. War-risk insurance for a tanker costs, according to estimates, about 30 times what it cost before the crisis. And Brent, the benchmark oil in Europe, has risen to about 106 dollars a barrel, against about 72 before 28 February.
The door remains almost closed. But this episode is not about the door. It is about what has already passed through it and has not yet reached you.
1. The result of your test: zero
In episode 2 I asked you for a number from 0 to 5: how many of the essential things in your home stop if the electricity goes off. I promised to publish the result. I am keeping my promise: the post was viewed more than a thousand times, received five reactions and not a single number.
This is not a criticism of those who read it. It is the most instructive result I could have received. Reading about a risk takes two minutes; stopping for ten minutes to measure it is something else. It is exactly what happens in organisations: the emergency plan is read, approved and filed away, and the test is left for later. Until the day the lights go out.
A plan that has never been tested is not a plan. It is a hypothesis.
2. Five pieces, five delays
In episode 1 (in Portuguese) I described the crisis as a domino of five pieces. Each piece knocks over the next, but with an ever-longer delay. Seven months have passed. It is now possible to put a date on each piece.
Every domino piece that falls raises a wave. The domino tells the order; the waves tell when and where each piece arrives. The image shows all five, one by one, with what is at stake and an example at home and in business.
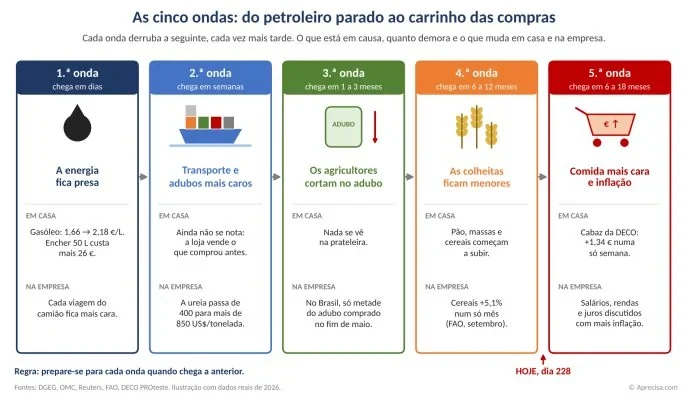
Read the image from left to right, like a row of dominoes. Each card is a wave: at the top, how long it takes to arrive; in the middle, what is at stake; at the bottom, a real 2026 example at home and another in business. Notice the first two “At home” lines: in waves 2 and 3 nothing can be seen on the shelf, and that is precisely why almost nobody prepares. The red arrow marks where we are today.
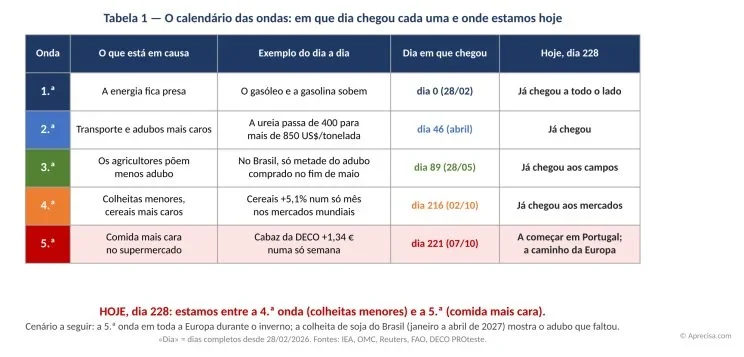
Read the table from top to bottom, like someone counting the days. The first wave arrived on the very day of the closure; the second, 46 days later; the third, after three months; the fourth and fifth, more than seven months later. The pink row is today’s: more expensive food is beginning to reach the Portuguese basket and is still on its way to the rest of Europe.
The practical consequence is uncomfortable. Even if Hormuz reopened tomorrow, the waves that have already set off would keep arriving for months. Just as on the motorway: clearing the accident does not undo the queue that has already formed.
Stop for 10 seconds: in your home or your business, what was the last thing that became more expensive? And how many months ago did the cause begin?
3. Why bread rises less, and later
If diesel went up 31%, why did bread not go up 31%? Because the final price is a mixture. Each ingredient of the cost carries a share, and only that share goes up.
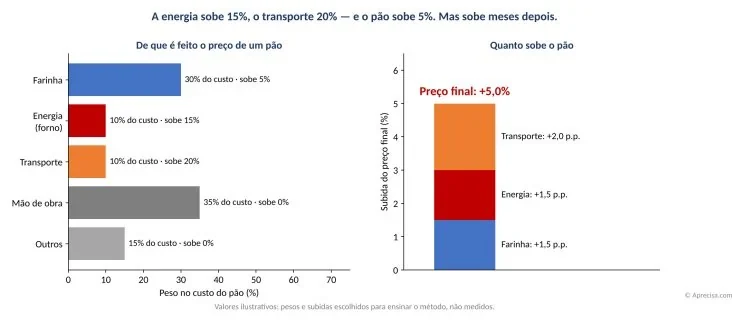
On the left is the “recipe” for the cost of a loaf: flour, oven energy, transport, labour and the rest. Each bar is the weight of that part in the cost and how much it went up. On the right is how much each part pushes up the final price. The parts that do not rise, such as labour in this example, dilute the shock. That is why bread goes up much less than diesel.
The equation:
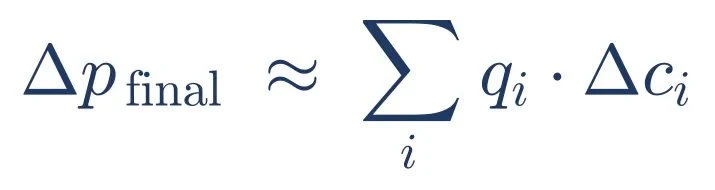
Δp (read “delta p”) is the rise in the final price. Each q is the weight of one part in the cost; flour, for example, weighs 30%. Each Δc is how much that part went up. You multiply the weight by the rise and add up the terms: 0.30 × 5% + 0.10 × 15% + 0.10 × 20% = 1.5 + 1.5 + 2.0 = 5.0%.
There is a second, hidden lesson. Part of the cost only passes into the price once the old stock, bought cheaply, runs out. The flour sitting in the bakery’s storeroom today was bought months ago. Between the cause and the price there is a layer of stocks and contracts that works as a shock absorber and, at the same time, as a clock. It is this layer that creates the delay.
The 2022 yardstick: the European Central Bank (ECB) estimated that direct energy accounts for only about 3% of the non-wage costs of the euro area food sector. It seems little. But the same data show the force of the delay: the wholesale price of gas peaked in September 2022; food inflation peaked, at close to 15%, in March 2023. Six months later. Energy comes in very little through the front door and a great deal through the side doors: fertiliser, freight, packaging, refrigeration.
In 2022, gas hit the ceiling in September. The plate hit the ceiling in March. The queue took six months to reach the table.
4. The answer to the opening question
Diesel went from 1.659 euros per litre on 1 February to 2.180 euros on 2 October: up 31%.
And the basket? On 27 February, the day before the strait closed, it cost 253.19 euros. On 7 October it cost 255.56 euros. Up 2.37 euros. Less than 1%.
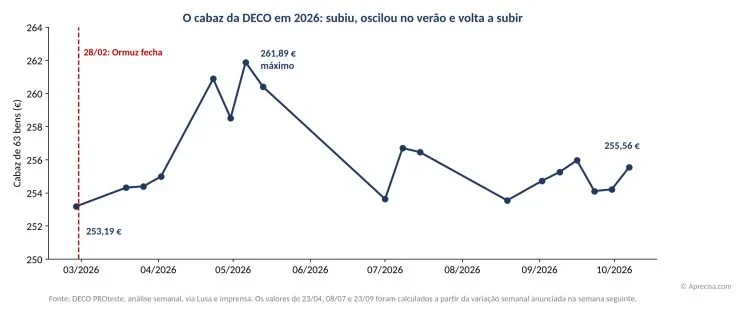
Each point is a weekly value of the 63-item basket published by DECO; between some points there are weeks with no value collected for this chart. The dashed red line marks the closure of the strait. What matters is the shape: a first jolt in the spring, a summer of ups and downs between 253 and 257 euros, and a new rise precisely when cereals shoot up on world markets.
Those who answered “close to 30%” confused the accident with the queue. Those who answered “almost nothing” were right. For now.
Because last week’s signs are the start of the 5th wave, the wave of more expensive food: the basket rose 1.34 euros in a single week; wholegrain cereals rose 29% in seven days; horse mackerel is 42% dearer than a year ago; since January, the basket has already risen 5.68%. And the FAO warned, on 2 October, that if these pressures persist, they will soon pass into the prices paid by consumers.
If 2022 serves as a yardstick, with about six months between the energy peak and the food peak, the rise now on world cereal markets should gradually reach the supermarket over the winter and spring. It is not a prophecy. It is the sum of the delays.
Do the sum at home: find a shopping receipt from February and compare it with this week’s. Tell me in the comments how much yours went up, as a percentage.
5. The same wave, four continents
The stone fell in one single place, but the queue spreads across the whole world, and on each continent it comes in through a different door.
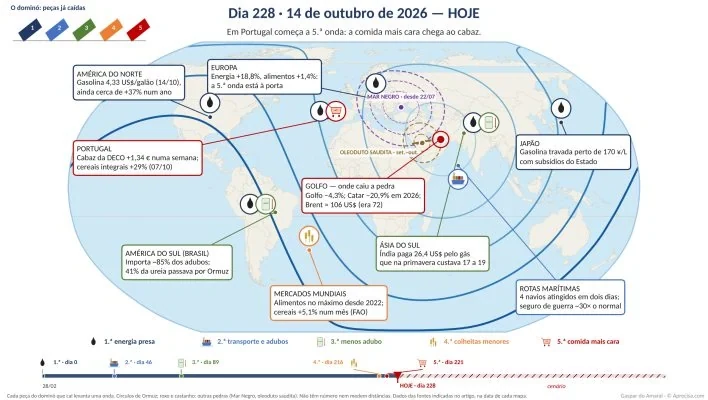
The new element is the shopping trolley in Portugal: it is the 5th wave reaching the basket. In Europe, energy is already 18.8% more expensive, but food is still only rising 1.4%: the European trolley has not yet appeared.
Europe: it comes in through the energy bill. Energy +18.8% in a year; food still only +1.4%. The 5th wave, the wave of more expensive food, is at the door.
North America: it comes in through the petrol pump. A gallon cost 4.41 dollars on 1 October, up 40% in a year, in a country that produces more oil than it uses.
South America: it comes in through fertiliser. Brazil imports about 85% of the fertilisers it uses. Less fertiliser today means less soya tomorrow, and that soya also feeds pigs and chickens in Europe.
Asia: it comes in through power cuts. Pakistan scheduled power cuts and shut down fertiliser factories to send the gas to the power stations.
And other stones have fallen into the same pool: the Black Sea ports, through which about 27% of the world’s wheat leaves, have almost stopped, and the Saudi pipeline that bypassed Hormuz has been hit twice. When the waves from two stones meet, they add up.
Watch the waves move: the video of about a minute and a half showing the evolution from day 0 to the winter, with the news that confirms each step, is in the post that accompanies this article.
The door can open in a day. The queue takes years to clear.
6. The clock of the waves: act on the previous wave
If each wave arrives with a delay, that delay is time. And time, in resilience, is the only thing that cannot be bought on the day of the crisis.
The rule is simple: the best moment to prepare for a wave is when the previous one arrives. The interval between the two is your deadline to decide.
Today, day 228, we are between the 4th wave, the wave of smaller harvests, and the 5th, the wave of more expensive food and inflation. This means that the time to prepare for more expensive food is now. Not when it appears in the news.
At home: review the shopping budget six months ahead and not month by month; try alternative brands and formats before the rise, not after; keep a rotating two-week store cupboard, which you use up and replace, so as not to waste anything.
In business: ask each supplier when the stocks and contracts bought at the old price run out, because that date is the date of your next price rise; review selling prices and payment terms; protect your cash flow before inflation reaches interest rates.
In the State: follow the indicators of the earlier waves, such as freight, fertilisers and sowing, and not only the final price. When the rise appears in the inflation statistics, the window to act has already closed.
7. What is foreseeable: the calendar to 31 December 2028
Up to here, the report of what has already happened. Now, the plan of what can be expected to happen, and on what date. It is a scenario, not a prophecy: it rests on three assumptions that any reader can check.
The three assumptions, all with a source: the strait begins to reopen on 31 December 2026, day 306 (World Bank); the waves recede in the same order in which they arrived, and the fall is slower than the rise, as in 2022; and rebuilding world stocks may take up to two years (Aramco), that is, until 31 December 2028, day 1037.
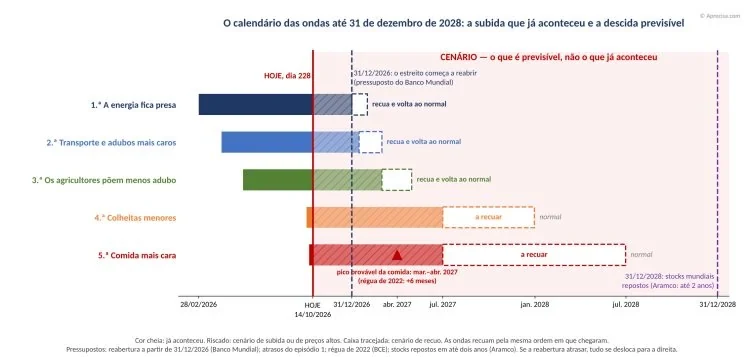
Each row is a wave. The solid colour, to the left of today’s red line, is what has already happened. The hatching is the time during which prices should stay high. The dashed box is the foreseeable recession. Notice the staircase: energy falls back as early as January 2027, but food only begins to come down in mid-2027 and only finishes receding in the middle of 2028. The red triangle marks the probable food peak, in March and April 2027.
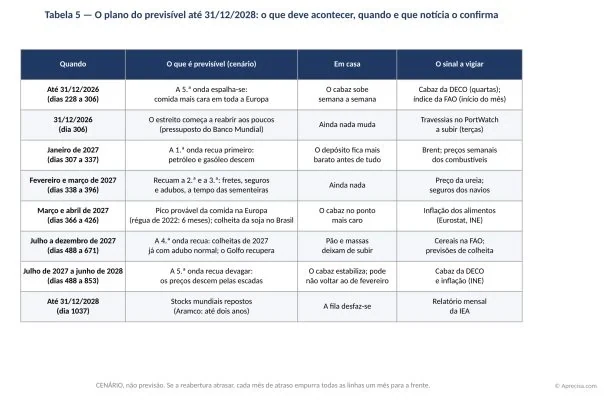
Read the table from top to bottom, like a diary. The last column is the most important: it says which news will confirm, or refute, each row. That is what turns a forecast into a plan that can be checked. In the next episodes, the rows will be crossed off as the news arrives.
The rise came by lift. The fall comes by the stairs.
And what if the strait does not reopen on 31 December? Then the whole calendar moves to the right. It is the sum of the delays at work: each month of delay at the door adds a month to every wave.
Keep Table 5. In three months’ time, compare it with the news. That is how you measure whether a plan was right.
In the comments on this article, every two days, three supplements in PDF:
- 15 October, day 229 — The pool in four moments: the four maps of the waves, from day 213 to the winter.
- 17 October, day 231 — Four continents and other stones: where the wave comes in in each part of the world, the Black Sea, the Saudi pipeline and what each wave leads to in the extreme case, hunger.
- 19 October, day 233 — The clock of the waves: what to do at home, in business and in the State, and the form for making your plan in 10 minutes.
The numbering of the tables is shared by the article and the three supplements: Table 1 and Table 5 appear here.
Your turn
Answer in the comments with just one letter: which is the next wave to reach your home or your business?
- A) Fuel and energy
- B) The shopping basket
- C) Loan repayments and interest
- D) I don’t know yet, and that worries me
And the second chance: take the test from episode 2 and leave your number here too, from 0 to 5. In episode 4 I will publish the result, whatever it is.
Do you know someone who does the shopping for a canteen, a care home, a private social-solidarity institution (IPSS, a Portuguese non-profit social-care body) or a small business? I will send them supplement 3, “The clock of the waves”, which comes out in the comments on 19 October, with the form to fill in. The window to prepare for the 5th wave, the wave of more expensive food, is open now.
Today’s shock is news. Tomorrow’s bill is arithmetic.
This is episode 3 of the series “A Porta Estreita” (The Narrow Door). Next Tuesday, 20 October: episode 4, The illusion of having two, why two suppliers, two routes or two networks are not always worth two.
Subscribe to the newsletter to receive each episode on Tuesdays.
#Resilience #SupplyChains #FoodSecurity #Inflation #RiskManagement #Portugal
Follow the waves, every day
The five waves of this series are measured every day on the “A Porta Estreita” Panel (in Portuguese), with open data: the 1st, trapped energy (ships in Hormuz and Brent oil); the 2nd, more expensive transport and fertilisers (urea price); the 3rd, less fertiliser in the fields (urea compared with wheat); the 4th, smaller harvests and more expensive cereals (FAO index); and the 5th, more expensive food (food inflation and the DECO basket). Every number comes with the sum worked out step by step, so that you can redo it with pencil and paper.
Think of a weather forecast: the article explains how storms form; the panel says what the weather is like today. And the series’ forecasts are recorded with the date on which they were made, so that the data themselves say whether they were right: see whether the forecasts were right · for schools (in Portuguese).
Methodological note
Methodological note of the original. (1) “Day” means the complete days since 28/02/2026; some monitors count differently and show a difference of one day. (2) Diesel: (2.180 − 1.659) ÷ 1.659 = +31.4%. (3) Basket: (255.56 − 253.19) ÷ 253.19 = +0.94%. (4) The basket values for 23/04 (€260.89), 08/07 (€256.71) and 23/09 (€254.11) were calculated from the weekly change announced the following week; the others are published by DECO PROteste. (5) The six-month interval between the gas peak (September 2022) and the food inflation peak (March 2023) is my own calculation from the ECB dates; the ECB does not estimate that delay. (6) The bread example uses illustrative weights and rises. (7) The dates of the waves in Table 1 are those of the facts cited in the text; the typical delays are those of episode 1. (8) Today’s map: the circles are illustrative, without measuring distances; the icons in each region correspond to dated facts cited in the references. (9) Future calendar: 31/12/2026 = day 306; 31/12/2028 = day 1037; the recessions use, from the reopening, the typical delays of episode 1; the food peak in March and April 2027 applies the 2022 yardstick. Text and figures by the author, AI-assisted.
What this page is. A translation of the article the author published on LinkedIn on 14 October 2026, episode 3 of the newsletter “A Porta Estreita” (The Narrow Door); the full Portuguese version is on this site. Numbers, dates and sums are those of the original; only the decimal separator follows English usage.
Changes of form, not of content. The decorative symbols (emoji) and dividing lines of the LinkedIn version were left out. The nine original images are reproduced as they are, with their texts in Portuguese; each caption translates the original caption and the texts of the image. The links to sources are those of the original; the titles of the sources stay in their original language. The section “Follow the waves, every day” comes from the article’s page on this site.
References
- Straits.live (14/10/2026) — situation in the Strait of Hormuz: latest IMF PortWatch count (4 crossings on 04/10), Brent, war-risk insurance
- Straits.live — boletim diário (14/10/2026) — two more ships hit in the strait, according to UKMTO, via The Maritime Executive
- Straits.live — boletim diário (13/10/2026) — tanker and container ship hit by projectiles of unknown origin in the strait
- Straits.live — boletim diário (12/10/2026) — drone attack on the tanker Petro Dolphin; two Indian sailors missing
- FMI — PortWatch — daily traffic in the Strait of Hormuz
- OMC — Organização Mundial do Comércio (10/07/2026) — fertilisers: urea above 850 USD/t in April
- FAO (2026) — risks to food security and the limit of the sowing season
- FAO (02/10/2026) — FAO Food Price Index for September 2026
- DECO PROteste, via DNoticias / Lusa (07/10/2026) — 63-item basket: €255.56; +€1.34 in a week; +5.68% since January (in Portuguese)
- DECO PROteste, via Renascença (27/02/2026) — 63-item basket: €253.19 (in Portuguese)
- DECO PROteste, via RTP (05/2026) — basket reaches €261.89 (in Portuguese)
- DECO PROteste, via ECO (13/05/2026) — basket falls to €260.41 after the record (in Portuguese)
- Contas Poupança (02/10/2026) — average diesel price on 01/02/2026 (€1.659/L) (in Portuguese)
- DGEG / ACP, via O Digital (02/10/2026) — average diesel price (€2.180/L) (in Portuguese)
- INE, via TSF (30/09/2026) — inflation of 3.6% in September; energy +15.4% (in Portuguese)
- BCE — Boletim Económico 2/2024 (2024). What were the drivers of euro area food price inflation over the last two years? — ECB Economic Bulletin box on the drivers of food inflation
- Eurostat, via NewKerala (02/10/2026) — flash estimate of euro area inflation in September: 3.8%; energy +18.8%; food +1.4%
- AAA (01/10/2026) — US national average petrol price: 4.41 US$/gallon; 3.16 a year earlier; record September
- ISTOÉ / Deutsche Welle (12/03/2026) — Brazil imports about 85% of its fertilisers (Embrapa); 41% of the urea imported in 2025 passed through Hormuz (Agrinvest) (in Portuguese)
- Reuters, via Datamar News (08/06/2026) — Brazilian soya farmers had bought about 50% of their 2026/27 fertiliser, against more than 60% usually
- Wood Mackenzie (12/10/2026) — South Asia: dependence on liquefied natural gas from Qatar; power cuts; prices paid by India
- CSIS (26/08/2026) — Pakistan: scheduled power cuts and fertiliser factories shut down
- Nippon.com / Jiji (25/08/2026) — Japan keeps the target price of petrol close to 170 yen per litre
- DECO PROteste, via ECO / Postal / Observador / DNoticias / RTP (07–09/2026) — weekly basket values in the summer: €253.63 (01/07), €256.46 (15/07), €253.55 (19/08), €254.73 (02/09), €255.97 (16/09) (in Portuguese)
- Observador / Lusa (19/08/2026) — food basket rises 1.48 euros to 253.55 euros (in Portuguese)
- DailyFuels (09–10/2026) — average diesel price in Portugal in September 2026 (≈ €2.16/L)
- Straits.live — boletim diário (05/10/2026) — 239 ships with AIS stopped in the area of the strait and the Gulf
- Banco Mundial, via The National (06/10/2026) — forecasts for the Middle East and North Africa and for the Gulf in 2026
- CSIS (11/09/2026). How Do the Latest Black Sea Attacks Affect Global Food Security? — 27% of world wheat; ports at a standstill; USDA −11%
- The Moscow Times (17/08/2026). Ukrainian Strikes Halt Most Russian Grain Exports in the Black Sea — Russian grain exports through the Black Sea
- Al Jazeera (12/09/2026). Saudi Arabia shuts critical oil pipeline after drone attack — closure of the Saudi East-West pipeline after a drone attack
- Türkiye Today / AFP (05/10/2026). Saudi East-West pipeline halted again after fresh attack — new halt of the Saudi pipeline
- FAO e PAM (17/06/2026). Hunger Hotspots — 13 hunger hotspots; food-aid funding −59% between 2022 and 2025
- ONU News (17/03/2026). Middle East war risks pushing 45 million more people into acute hunger — 45 million more people at risk of acute hunger
- Euronews (13/10/2026). «People survive on one meal a day»: Oleshky — Oleshky (cannot be independently verified)
- Malay Mail / AFP (10/10/2026). A year after Gaza ceasefire, families still queue hours for one meal a day — Gaza: families queue for hours for one meal a day
- Gaspar do Amaral (27/09/2026). Dia 211: A Porta Estreita por onde passa a nossa resiliência (episódio 1) — episode 1 of the series (in Portuguese)
The discussion is on LinkedIn (in Portuguese)
Comments on this text are made on LinkedIn, where the article was shared in Portuguese. You are welcome to write in English. Agree, disagree or add data: every well-founded objection receives a reply.
Gaspar do Amaral · Original in Portuguese of 14 October 2026, published on this site; translation issued on 27 October 2026 · Figures and tables © Aprecisa.com · AI-assisted