 ← Grupo Aprecisa · Connecting those who know with those who need
Housing · Simplifying responsibly · The Housing Panel
The Missing Needle
Simplifying responsibly: what the Housing Panel already measures about housing in Portugal, and the number nobody measures yet
Gaspar do Amaral · 2 November 2026
Translated from the Portuguese original. This version was issued on 2 November 2026.
On this site, this article has been
The cover explained
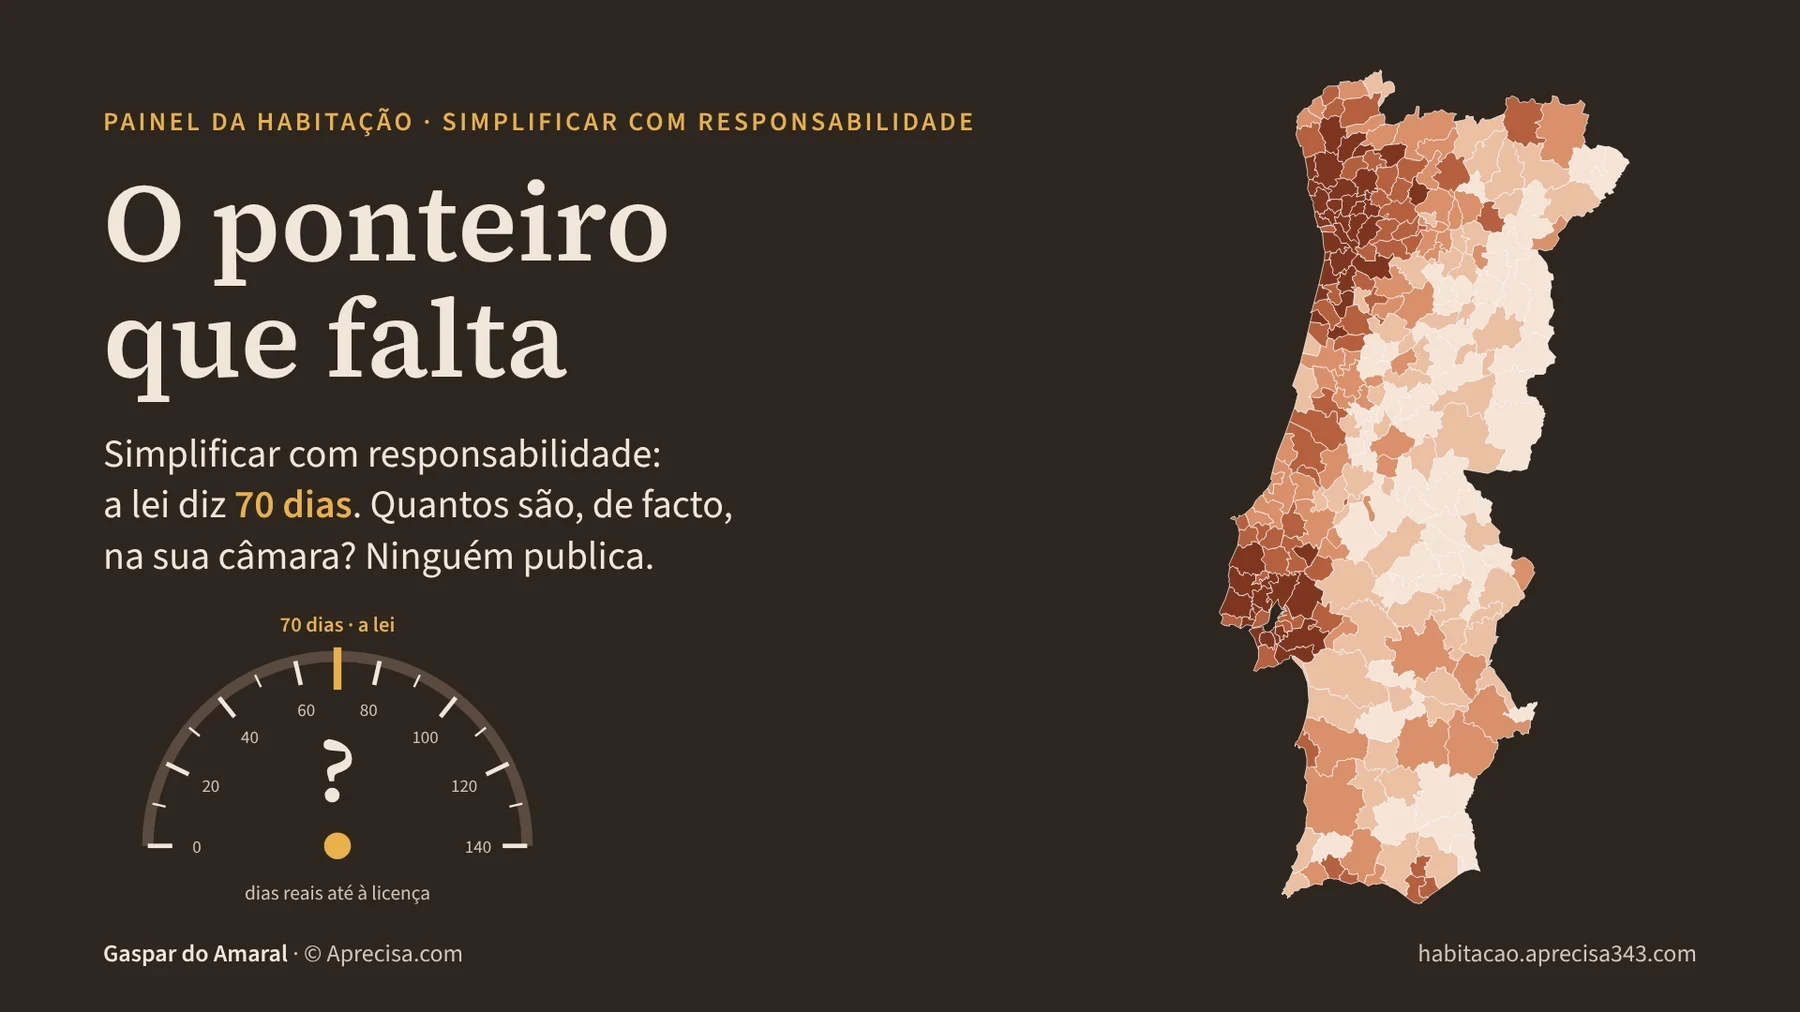
The cover shows a car dial with no needle. The scale is marked with the time the law gives councils to decide an application for a building permit for a home: 70 days, adding up the three stages of the new regime (20 + 30 + 20 = 70). The needle, which would show how many days really pass, is not there, because no body publishes that number regularly, council by council. Next to it, the map of the 278 municipalities of mainland Portugal, coloured with the Housing Panel’s data, is a reminder that the country is not one place: each council has its own pace. The cover says in one picture what this article says in words: we have the rule, but we are missing the needle.
1. The engineer and the clock
Marta is a civil engineer in Braga (the name is invented; the situation is not). In October 2026 she submitted to the council an application for a permit for an apartment block of twelve homes. Her client asked her the question every client asks: “When can I start building?”
Marta opened the law. The new legal regime for urban development and building (RJUE), in force since 1 October 2026, gives the council 20 days to check whether the application is complete, 30 days to decide on the architectural design and 20 days for the final decision. The sums are simple:
20 + 30 + 20 = 70 days, if all goes well and there are no extensions.
But Marta knows that “the law says” and “the council does” are not the same sentence. She wanted to know how long her council really takes. She looked in the official statistics. She looked in the reports. She found nothing. Not because Braga council hides anything, but because nobody publishes that number, neither for Braga nor for any of the country’s 308 councils.
Marta answered her client honestly: “The law says 70 days. How long it will take, I cannot tell you.” It is like driving with a speed limit clearly painted on the road and a speedometer with no needle.
2. Seven fronts, no needle
The response to the housing shortage is usually organised into seven fronts, which appear, under different names, in almost every plan and debate:
- public investment in new building and refurbishment;
- public, cooperative and affordable supply, including empty homes;
- serviced building land and municipal plans;
- the capacity to build, and to build faster;
- simplifying responsibly: clear rules, deadlines that are met, without losing technical safety;
- a more coherent legal framework;
- linking housing to the territory, to transport and to energy.
Everyone agrees that results must be monitored. Few say where we are starting from and how we will know, a year from now, whether each front has moved forward. Without a starting figure, a plan is an intention. This is where the Housing Panel comes in.
2.1 What I had already written, and what this article adds
This text continues two of my articles.
In “A Física da Construção” (The Physics of Construction, 26 March 2026), I audited two causes put forward for the shortage of new homes. The first, the cost of production, was confirmed by the data of Statistics Portugal (INE): the cost of materials was almost flat, about 1% in a year, while the cost of labour was rising by between 8.7% and 9%. The second, the unpredictability of permits, was not confirmed with the same strength: a study by UCI and Spirituc, of 611 people who had built their own home in the previous two years, found an average expected time of 105 days for the permit, met in 86.6% of cases. The conclusion was that the bottleneck had moved “from the council officer’s desk to the mud of the building site”.
In “A Anatomia da Realidade” (The Anatomy of Reality, 9 April 2026), I proposed a plan with four lines of action: territory, empty homes, industrialisation and investment. On permits, I stressed that simplification requires professionals to take personal responsibility for deadlines, without speed compromising planning.
This article does not change those conclusions. It adds two things that have changed since then:
- the law has changed: since 1 October 2026, the legal time limit for deciding on a building project is 70 days, less than the 105 expected days the study found;
- the panel measures more: the queue between the permit and the finished home (Figure 2) confirms, with the 2025 figures, that the main delay is on the building site.
And it adds a third: a survey, however good, is a photograph. It was carried out among people who built their own house, it measures the time each person expected, it does not identify councils and it is not repeated on a fixed date. To know whether the new 70-day limit is being met, council by council and year after year, we need a needle, not a photograph.
3. What the Housing Panel is
The Housing Panel (habitacao.aprecisa343.com) is a public dashboard I built to answer, in plain language, the questions anyone asks about housing in Portugal: are there enough homes, how much does it cost to buy, how much does it cost to rent, how many are being built, is public money arriving, how many rules does a builder have to comply with.
It works by four rules:
- Official data only: Statistics Portugal (INE), the Bank of Portugal, Eurostat, the OECD, the United Nations, the National Monitoring Committee of the Recovery and Resilience Plan (PRR) and, for municipal boundaries, the Directorate-General for Territory (DGT).
- Calculations in full view: every number has its source and its date, and every calculation is done step by step, so that it can be checked by hand.
- Automatic updates: the sources are read every week; when one fails, the question shows a “late” badge instead of hiding the delay.
- Facts only: no politics and no ideology.
Since 1 November, the panel also has the map of the 308 municipalities: anyone can type the name of their municipality and see its figures next to the country’s.
4. What the Panel already measures, side by side
Table 1 sets out the seven fronts side by side, what the panel already measures for each one and what is still missing.
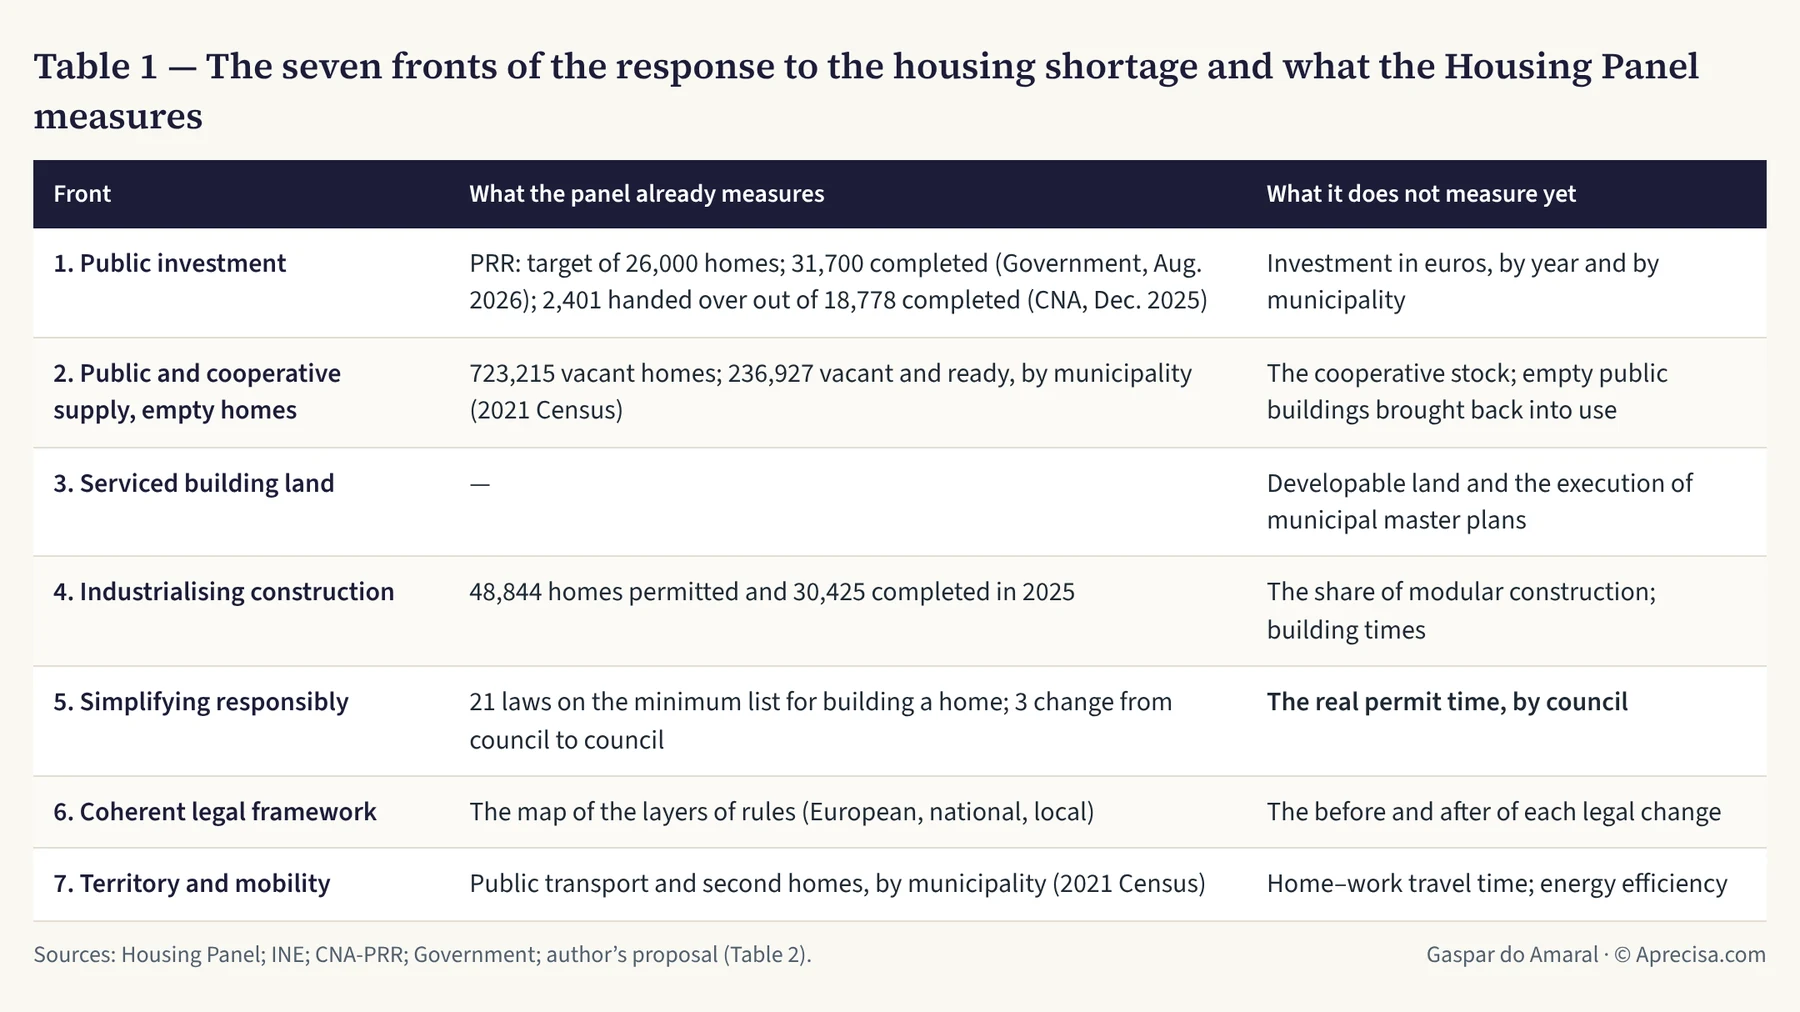
The table shows that the panel already gives a measured starting line for six of the seven fronts, and that the front where engineering weighs most, number 5, is precisely the one with the biggest gap.
Three starting figures deserve to have the sums shown.
The territory. In the country as a whole, for every 100 families living in an overcrowded home, there were 45 empty homes ready to live in (2021 Census):
236,927 ÷ 527,855 × 100 = 44.9, that is, about 45.
But the country is not one place. In Guimarães the figure is 27 (1,993 ÷ 7,314 × 100 = 27.2); in Alcoutim, 378. In 202 of the 308 municipalities there are fewer ready homes than overcrowded families. Figure 1 shows this.
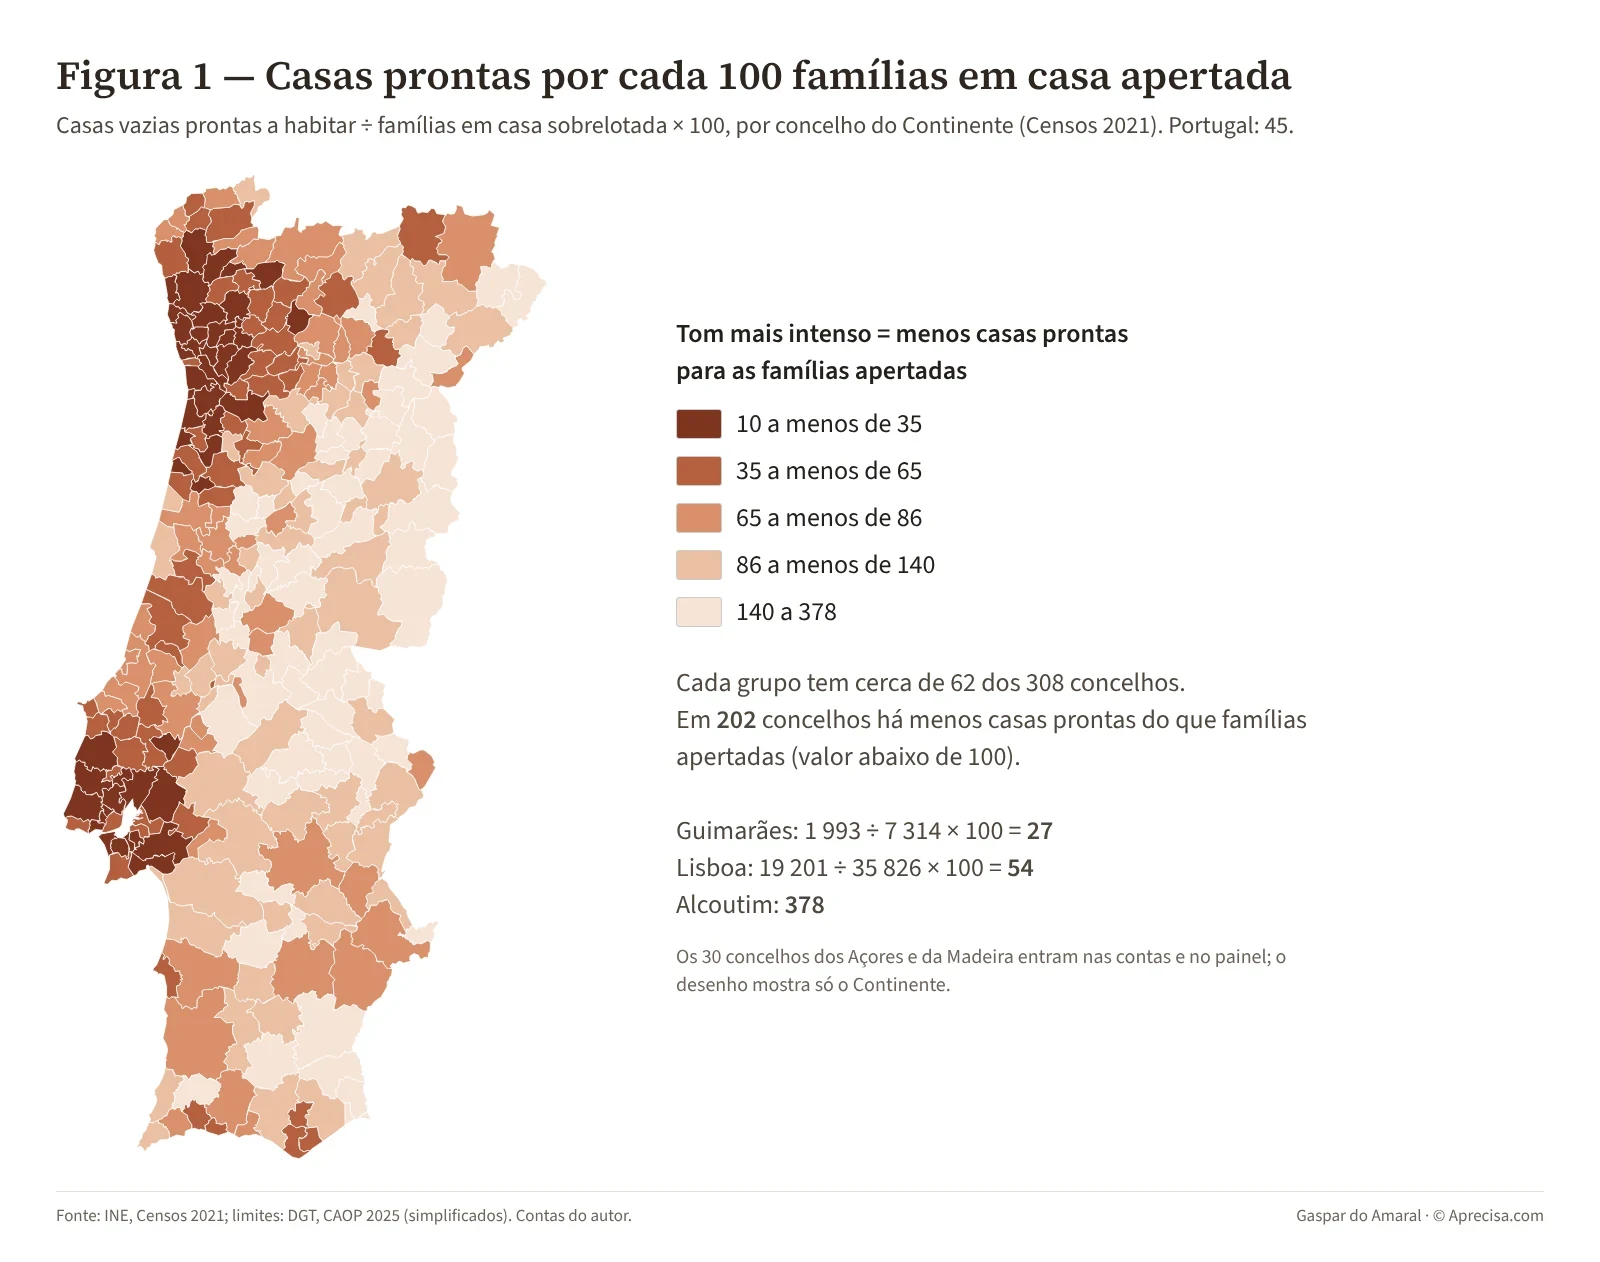
The figure colours each municipality of mainland Portugal according to this number: the 308 municipalities are ranked and split into five equal groups, and the darkest shade marks those with the fewest ready homes for overcrowded families. The dark patch on the northern coast and around Lisbon shows where the squeeze is greatest; the interior, lighter, has ready homes that nobody is looking for. What the figure means is simple: one policy for the whole country cannot fix a problem that changes from municipality to municipality. The Azores and Madeira are in the panel, with the same figures, but not yet on the map drawing.
The assembly line. In 2025, 48,844 homes were granted permits and 30,425 were completed:
30,425 ÷ 48,844 × 100 = 62.3 homes completed for every 100 permitted.
48,844 − 30,425 = 18,419 more homes in the queue.
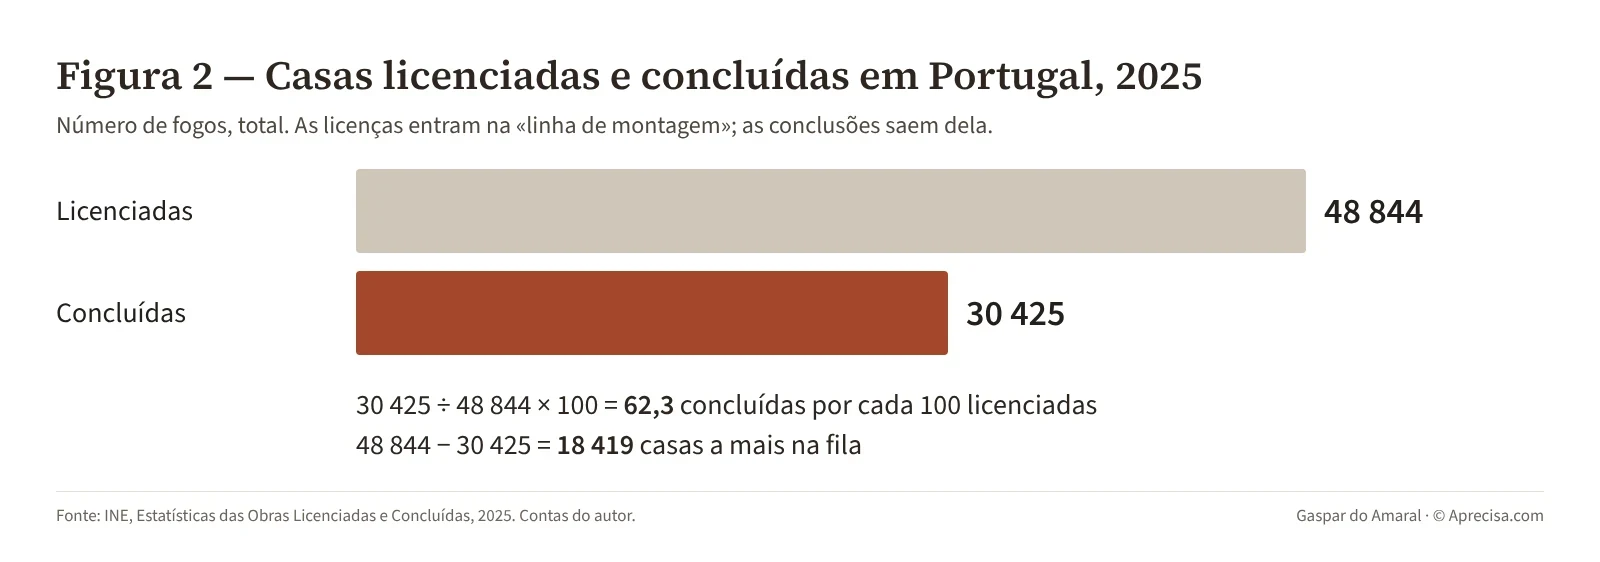
The figure compares the two bars: permits are the orders that go onto the assembly line; completions are the homes that come off it. More go on than come off, and the difference, 18,419 homes, stays in the queue. What the figure means: speeding up the permit without looking at the building work only shortens the queue at the entrance and lengthens the one inside.
Public money. In December 2025, the independent committee monitoring the Recovery and Resilience Plan counted 18,778 homes of the 1.º Direito (First Right) programme completed and 2,401 officially handed over to families:
2,401 ÷ 18,778 × 100 = 12.8%.
For the people who are waiting, a completed home only counts when they are given the key.
5. Simplifying responsibly: the two halves of the phrase
The fifth front fits into a phrase with two halves, and both count.
Simplifying means fewer steps, fewer counterparts, deadlines that are met. The new RJUE did the first part on paper: the councils’ decision deadlines became 20 days for the completeness check, 30 for the architectural design and 20 for the final decision on building projects (45 days for land subdivisions). Figure 3 draws that clock.
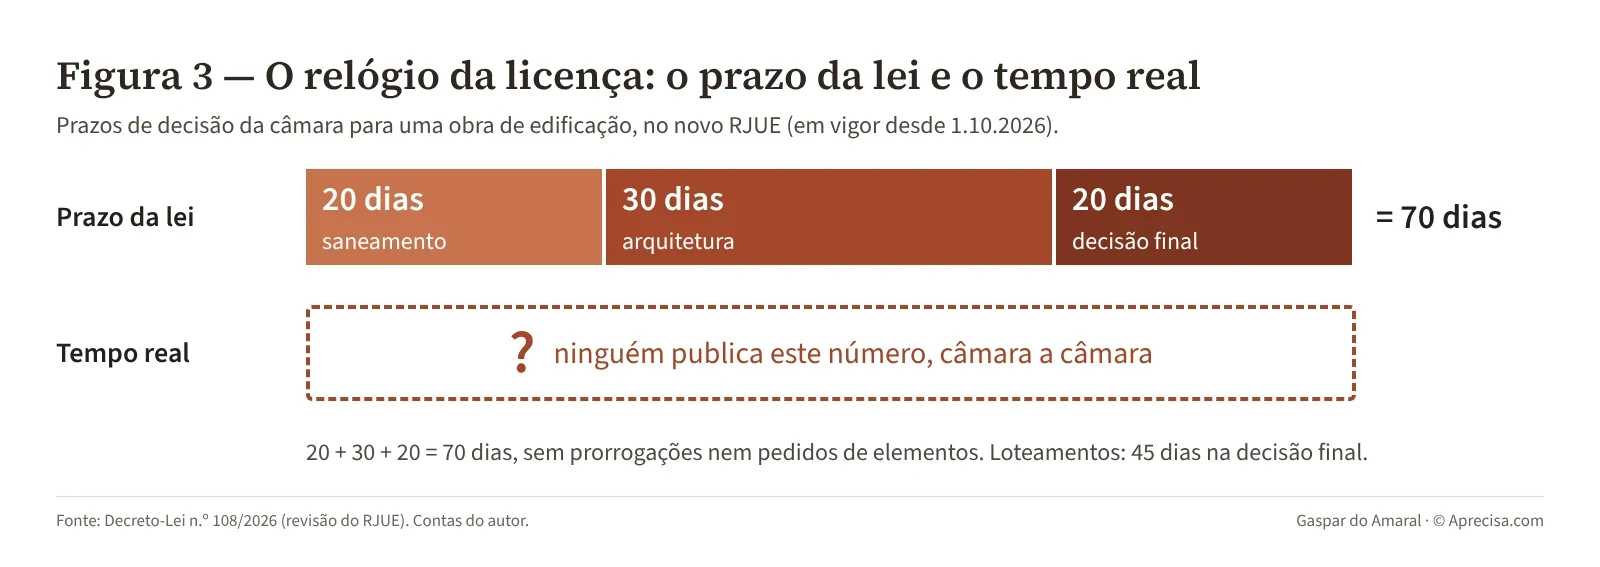
The figure shows, on a timeline, the three stages of the new regime and their deadlines: 20, 30 and 20 days, 70 in all. Below it, the bar for the real time is blank, with a question mark, because no data are published. What the figure means: we know how long it should take; we do not know how long it takes.
Responsibly is the other half. Simplifying cannot erase the technical acts, the involvement of qualified professionals, the checking of qualifications and inspection. It is the difference between removing red tape and removing safety. A permit in 10 days that lets a badly designed project through is not simplification: it is risk passed on to the people who will live in the home.
For an engineer, the phrase translates into a well-known rule: what is not measured cannot be managed. In a telecommunications network, nobody accepts a quality-of-service agreement without measuring the response time. Measuring is not mistrust; it is the only way of knowing whether the promise is kept. With the permit for a home, we have the promise written into the law and no meter installed.
6. Abroad, the needle exists
In England, the housing ministry publishes official statistics on development applications every three months, council by council. One of the measures is the percentage of applications decided within the statutory time limit: 13 weeks for major developments, 8 weeks for the rest.
The figures for April to June 2026 are very instructive, and Figure 4 shows them.
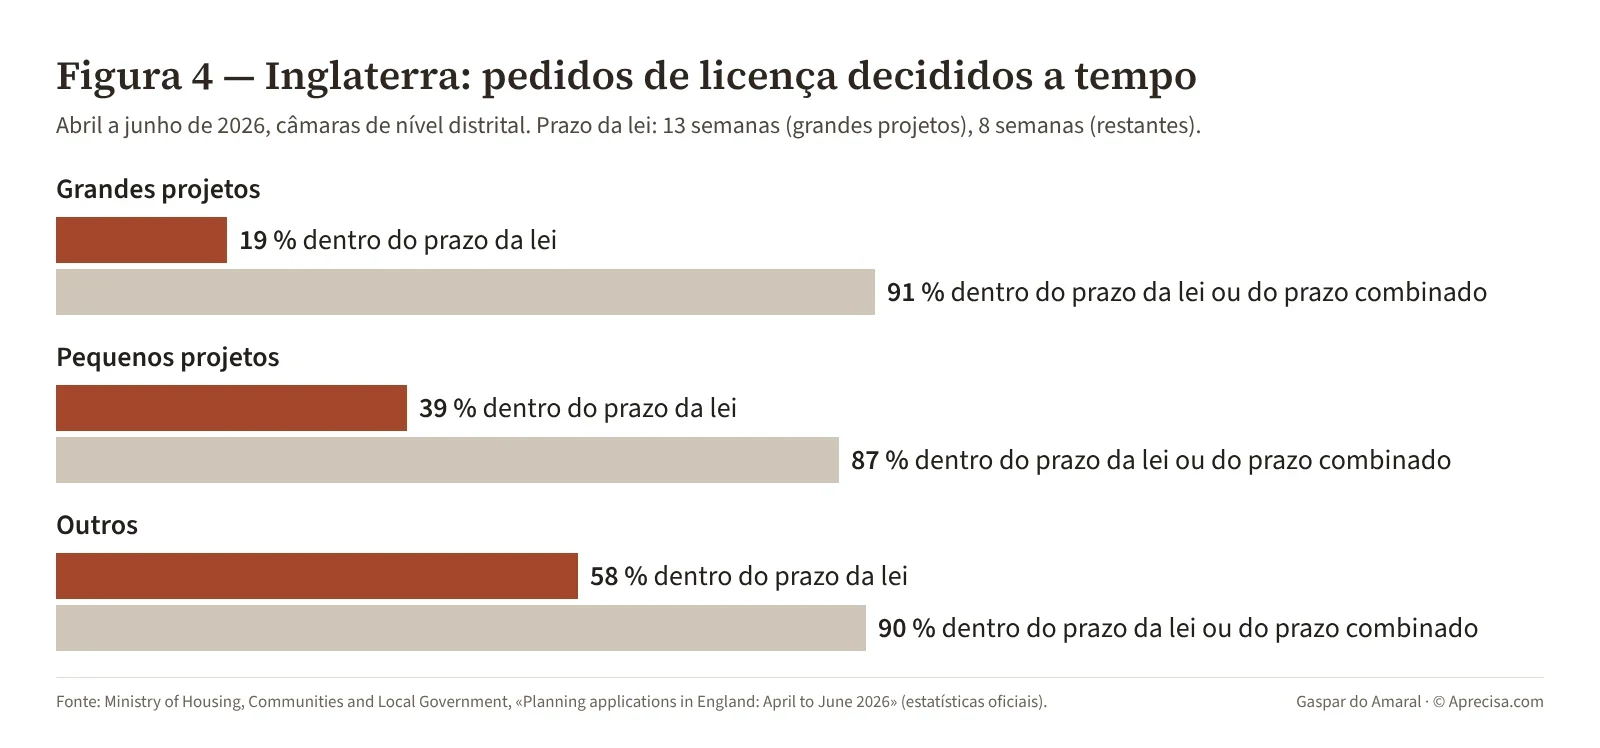
The figure compares two bars for each type of application. The short one is the percentage decided within the legal time limit; the long one adds the applications where the council and the developer agreed a longer deadline. For major developments, only 19 in every 100 meet the legal limit; with the agreed deadlines, the figure rises to 91. What the figure means: a short legal time limit only has meaning when we measure how often it is met. Without the number, 70 days may be 70 or may be 300, and nobody knows.
This is not about copying the English model. It is about noting that the indicator exists, is published by an official body and allows every citizen to compare their council with the next one.
7. Where the number is in Portugal
I looked for a public and regular source of the real time taken to grant permits, council by council. I did not find one. I did find five pieces:
- INE already has the raw material. For each application, councils fill in an INE questionnaire on building works (the Q3 survey). According to the completion instructions, the questionnaire records the date the application was received by the council. INE also knows when the work is granted its permit. With the two dates, the time can be calculated. INE does not publish it.
- There was a one-off estimate. Confidencial Imobiliário cross-checked applications and permits between 2019 and 2023 in mainland Portugal: applications for 128,800 homes, of which 75,550 were permitted (75,550 ÷ 128,800 = 58.7%, about 59%) and 53,200 were still undecided (53,200 ÷ 128,800 = 41.3%). The total is 128,750, not 128,800, because of the source’s rounding. It measures the volume held up, not the time, and it does not identify municipalities.
- There is a survey of people who built a home. The study by UCI and Spirituc, released in December 2025, heard 611 people who had built their own home in the previous two years: the expected time for the permit was, on average, 105 days, and 86.6% said it was met. The 13.4% who were delayed waited, on average, 70 days more. It is the best photograph available, and I used it in March; but it is a single survey, of those who answered, about the expected time, with no councils identified.
- The law has set the standard. The new RJUE gives us the ruler: 20, 30 and 20 days.
- A portal is coming. The Government has announced for the end of 2026 the “Licencia” portal, a single portal for urban planning, environmental and industrial licensing. The announcement does not say whether the portal will publish statistics by council. If it does, it becomes the natural source.
A caveat, for rigour: not finding a source does not prove it does not exist. There may be one-off studies, or councils that publish their own times. That is why I do not say it is unprecedented; I say that, as far as I could establish, it is not available in a regular and comparable form.
8. A dashboard for simplifying responsibly
What I propose is a small set of indicators, all of them calculable from official data, to monitor both halves of the phrase. Table 2 summarises them.
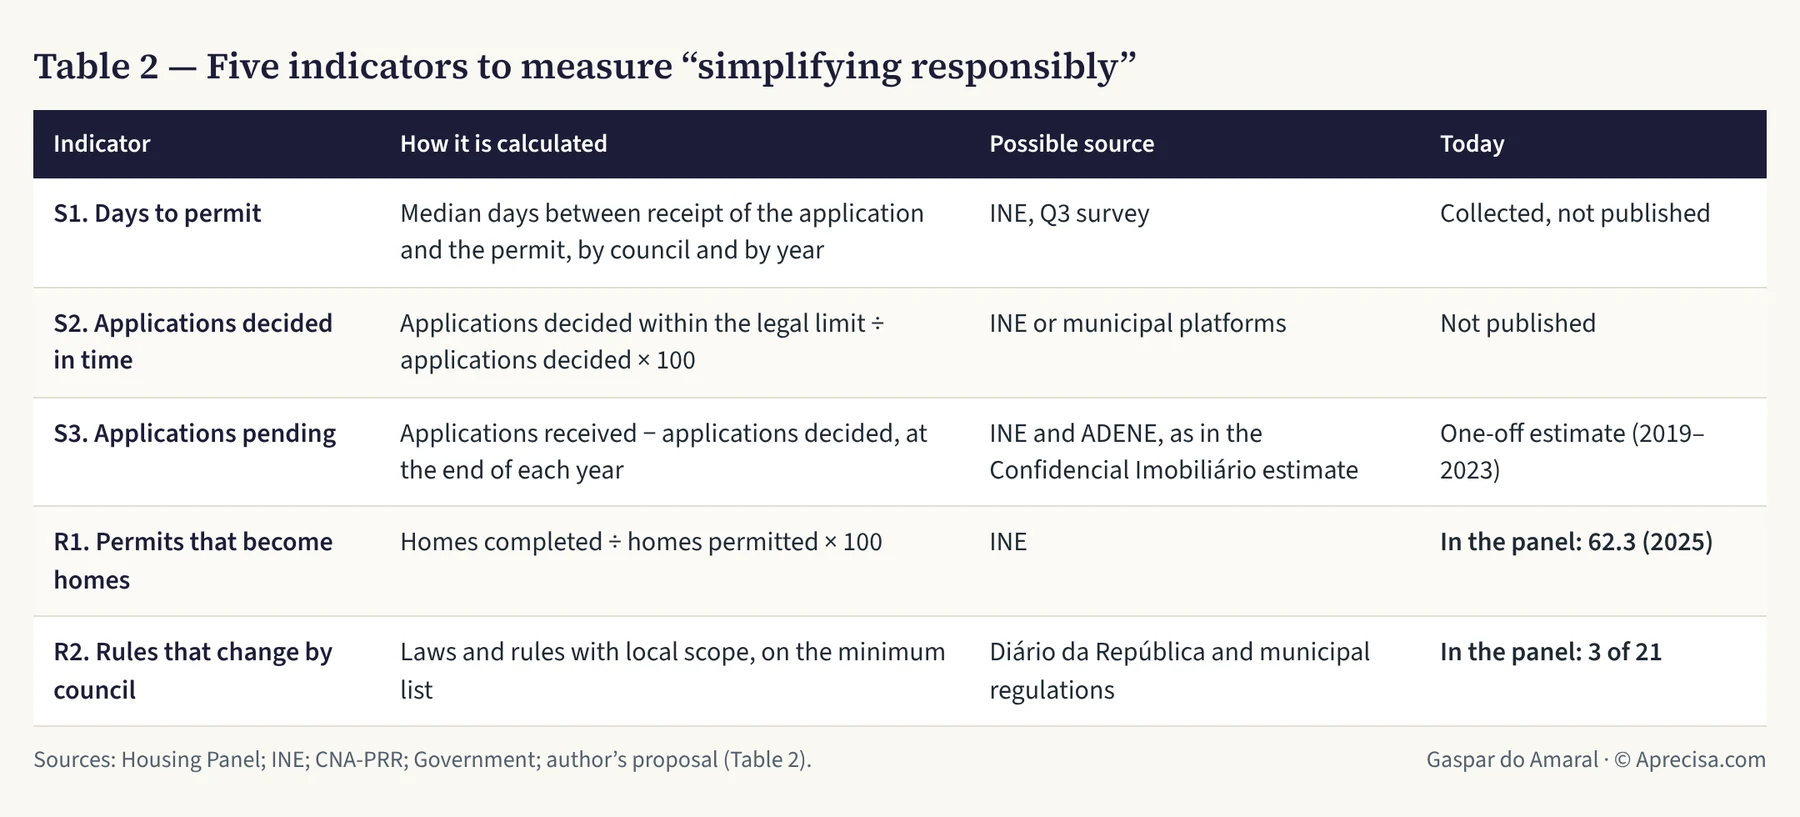
The S indicators measure simplification: the time, compliance with the deadline and what is held up. Indicator S2 is the regular, council-by-council version of the question the UCI and Spirituc survey asked once: “was the deadline met?”. The R indicators measure responsibility and coherence: whether the permit turns into a home and whether the rules are the same for everyone. Two are already in the panel; the first, the most important one, depends only on INE publishing what it already collects.
Indicator S2 is calculated like this. Imagine a council that, in one year, decided 400 applications, 260 of them within the legal time limit:
260 ÷ 400 × 100 = 65% decided in time.
(This is an invented example, only to show the calculation.)
9. What each person gains from the needle
For the family waiting for a home: knowing how long it takes, in their council, to go from design to building work, and planning their life with a number, not a guess.
For the engineer and the designer, like Marta: answering the client with data, and showing with facts when a delay is not the project’s fault.
For the mayor and the council’s technical officers: proving good work with a public indicator, and knowing where to strengthen the team before the queue grows.
For the journalist: comparing councils with the same ruler, instead of isolated cases.
For decision-makers: turning “simplifying responsibly” into a commitment that can be checked, year after year, instead of a promise.
10. The next step
The Housing Panel is open and free. Anyone can download the data, under a CC BY 4.0 licence. I make it available to anyone who wants to follow the seven fronts, from councils to professional associations and newsrooms, as a common base of figures.
The next step is to ask INE to compile the time between the receipt of the application and the permit, by council and by year, from 2019 onwards. When the number exists, the panel will gain a new question, “How long does it take to get a permit for a home in my municipality?”, with the legal time limit beside it and the map of the 308 municipalities.
On that day, Marta will be able to answer her client: “The law says 70 days. In our council, last year, the median was this.” And the dial on the cover will, at last, have its needle.
Methodological note
70-day limit: sum of the legal deadlines of the three stages of the permit procedure for building works under the new RJUE (20 + 30 + 20). It does not include extensions, suspensions to request further documents, or the developer’s own time.
Ready homes per 100 overcrowded families: vacant dwellings needing no repair or only light repairs ÷ households in overcrowded dwellings × 100 (2021 Census), added up over the 308 municipalities. The national figure (236,927 ready homes) is higher than the 154,075 “usable vacant” homes in another question of the panel, because INE, in its study, also deducts a margin for the market to work.
Figure 1: the 308 values are ranked and split into five groups with the same number of municipalities (quintiles). The municipal boundaries were simplified for the web (tolerance of about 500 m).
Figure 2 and indicator R1: dwellings permitted and completed, total, 2025 (INE).
Figure 4: values copied from the official English publication (district-level planning authorities, April to June 2026).
Table 2: the author’s proposal. The example for indicator S2 (400 applications, 260 in time) is invented and only serves to show the calculation.
105 days and 86.6%: figures from the UCI/Spirituc survey (611 people who built their own home; expected time for the permit, as stated by the respondents). Strictly speaking, they are not comparable with the 70-day legal limit, which is the maximum decision time of the council over the three stages.
Marta, the engineer: an invented character; the situation described (legal deadlines known, real time not published) matches what was established.
The data and calculations in this article are in the Housing Panel, at habitacao.aprecisa343.com. The article also exists as a video, with narration and subtitles in Portuguese: youtu.be/kV5xatRIs0Q. Text written with the help of AI. © Aprecisa.com
References
- A Física da Construção: Auditoria Factual ao Imobiliário e o Salto Industrial para Portugal (26/03/2026) — my audit of the cost of building and of permit times (INE; UCI/Spirituc survey)
- A Anatomia da Realidade: Um Plano de Engenharia Sistémica para a Habitação em Portugal (09/04/2026) — my four-line plan for housing: territory, empty homes, industrialisation and investment
- UCI e Spirituc — Construir Casa: Motivações e experiências de quem construiu casa nos últimos 2 anos (Diário Imobiliário, 11/12/2025) — survey of 611 people who built their own home: 105 expected days, 86.6% met
- Painel da Habitação — perguntas 1, 7, 16, 17 e 22 e «Como está o meu concelho?» (consultado a 02/11/2026) — the starting figures used in this article, by municipality
- INE — Censos 2021; Estatísticas das Obras Licenciadas e Concluídas (2025) — vacant and overcrowded dwellings; homes permitted and completed
- Comissão Nacional de Acompanhamento do PRR — relatório de dezembro de 2025 — 1.º Direito homes completed and handed over
- Decreto-Lei n.º 108/2026 (revisão do RJUE, em vigor desde 01/10/2026); ECO — Licenciamento urbanístico: o que muda — the new deadlines: 20 + 30 + 20 days
- INE — instruções de preenchimento do inquérito Q3 (projetos de obras de edificação) — the questionnaire already records the date the application is received
- Confidencial Imobiliário — pedidos e licenças 2019–2023 (Essential Business, 05/02/2024) — applications for 128,800 homes: 75,550 permitted, 53,200 undecided
- ECO — Governo promete «Licencia» com IA ainda este ano (12/05/2026) — the single licensing portal announced for the end of 2026
- Ministry of Housing, Communities and Local Government — Planning applications in England: April to June 2026 — share of applications decided in time, council by council, every quarter
- Direção-Geral do Território — Carta Administrativa Oficial de Portugal (CAOP 2025) — municipal boundaries used on the map
The discussion is on LinkedIn (in Portuguese)
Comments on this text are made on LinkedIn, where the article was shared in Portuguese. You are welcome to write in English. Agree, disagree or add data: every well-founded objection receives a reply.
When you show the post, its content is loaded from LinkedIn. Privacy (in Portuguese)
Gaspar do Amaral · Original in Portuguese of 2 November 2026, published on this site; translation issued on 2 November 2026 · Figures and tables © Aprecisa.com · AI-assisted