 ← Grupo Aprecisa · Connecting those who know with those who need
Energy and the power system
Ten Decibels Are Not Ten More
On the logarithmic scale — from the residents’ meeting to the submarine cable
Gaspar do Amaral · 10 October 2026
Translated from the Portuguese original. This version was issued on 27 October 2026.
On this site, this article has been
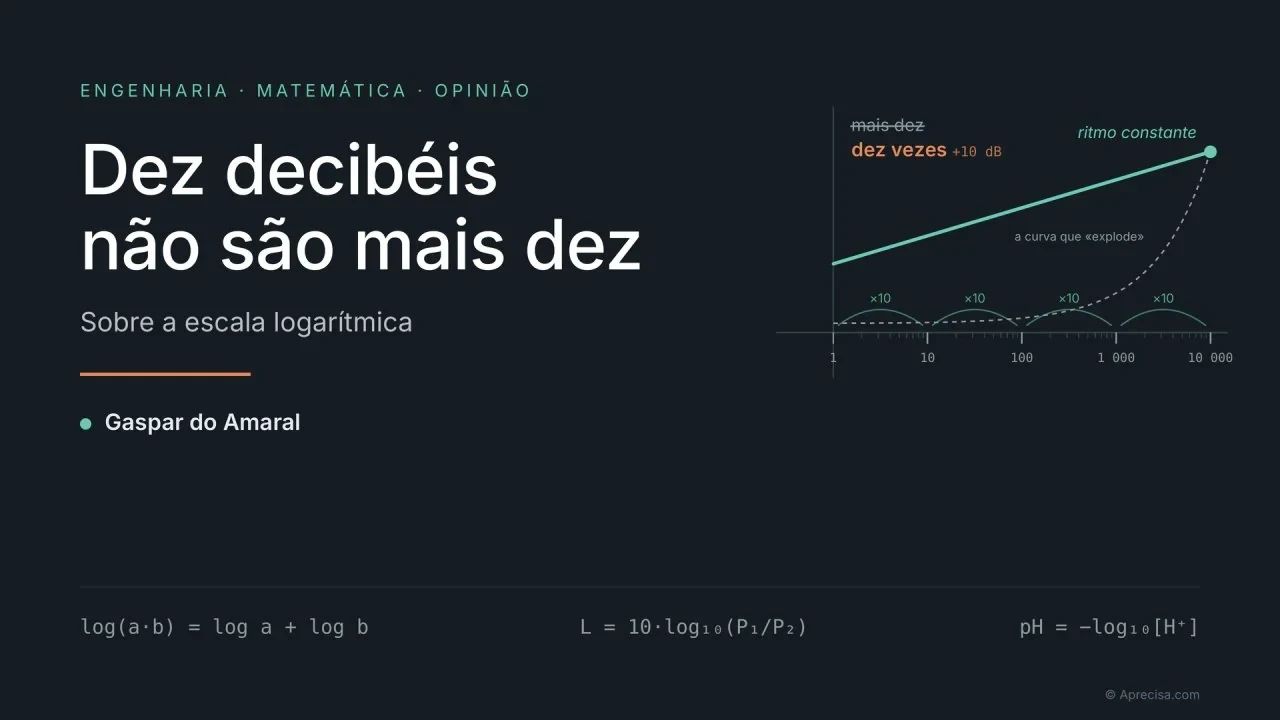
The scene is imagined, but anyone who has ever lived in a block of flats will recognise it.
A residents’ meeting. On the agenda, the bar on the ground floor. The owner, a pleasant and well-prepared man, has the measurement report under his arm and reads it with the calm of someone who is in the right: “The limit for the area is 55 decibels at night. We measured 65. It’s only ten more.” From the back of the room, someone agrees, with the composure of someone who watched the morning news: “Quite. And yesterday’s earthquake was only 5.3, too.”
In the front row, the lawyer the residents hired takes notes without looking up. Next to her, the treasurer, an economist by training, works on the reserve fund in a spreadsheet. Neither of them objects.
The room nods. And the answer the room deserves fits in one line: ten decibels are not ten more — they are ten times.
This article is that line unfolded. Because the confusion, apparently a domestic one, runs through three layers of engineering — telecommunications, energy, the Earth and the sky — and ends in a question anyone can ask of any number: does this ruler add or multiply?
In plain language. An ordinary ruler asks “how much more?”: 1 more, 10 more, 100 more. A logarithmic ruler asks “how many times more?”: double, ten times, a hundred times. The first is for measuring a table; the second is for comparing a coffee with a house.
I. The shortcut of 1614
Unlike imaginary numbers, the logarithm was not born with a disparaging name. It was born with a practical purpose. In 1614, the Scot John Napier published in Edinburgh the first table of logarithms, to spare astronomers and navigators the work of multiplying numbers with many digits. The idea was a shortcut: instead of multiplying two numbers, you added their logarithms and looked up the table. In 1624, Henry Briggs put them in base 10, with fourteen decimal places. The word says it all: logos and arithmos, the number of the ratio.
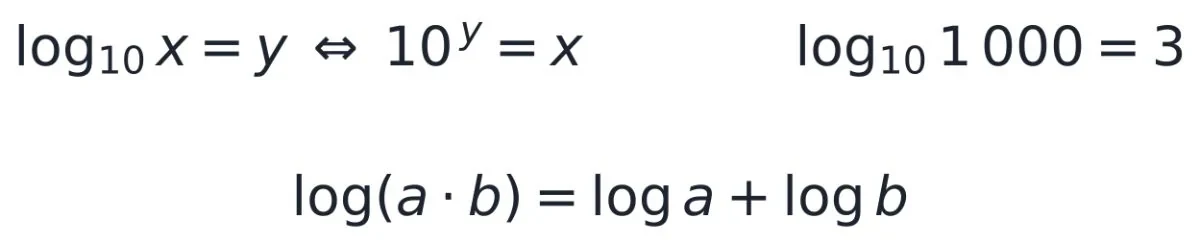
The first line is the definition: the base-10 logarithm of a number is the number of times you have to multiply 10 by itself to get there. That of 1,000 is 3; that of 100 is 2; that of 1 is 0. For round numbers, it is simply the number of zeros. The second line is the property that made the fortune of logarithms for three and a half centuries: the logarithm of a product is the sum of the logarithms. The slide rule, which engineers used until the 1970s, is exactly that: adding lengths to multiply numbers.
Anyone who has completed the 9th year of school already knows the essentials, even if they have never heard the word. They know that 103 = 1,000, that 102 × 103 = 105 — the exponents are added — and that the distance from the Earth to the Sun is written 1.5 × 10⁸ km, in scientific notation. The logarithm is just the name of the exponent: if 103 = 1,000, then log 1,000 = 3. And the rule that “the logarithm of a product is the sum of the logarithms” is the same rule of exponents learnt at that stage, seen the other way round.
In plain language. Take a round number and count the zeros: 100 has two, 1,000 has three, 1,000,000 has six. That number of zeros is the logarithm. A logarithmic scale is a ruler in which each mark adds a zero.
Napier’s table left a curious mark. In 1881, the astronomer Simon Newcomb noticed that the first pages of the tables of logarithms were more worn than the last: real-world numbers begin more often with 1 than with 9. Frank Benford confirmed it in 1938: the first digit is 1 in about 30% of cases and 9 in less than 5%. This is Benford’s law, which tax auditors use today to detect invented numbers.
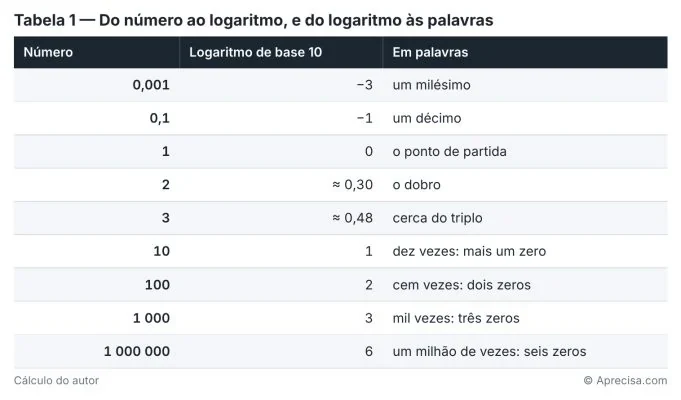
Table 1 bridges numbers, logarithms and words. The third column is the one that matters in everyday life: each unit of the logarithm is “one more zero”, half a unit is about three times and three tenths are about double. Anyone who memorises these three equivalences — 1 = ×10, 0.5 ≈ ×3, 0.3 ≈ ×2 — can read any logarithmic scale in their head.
Figure 1 shows the difference between the two rulers with six everyday prices.
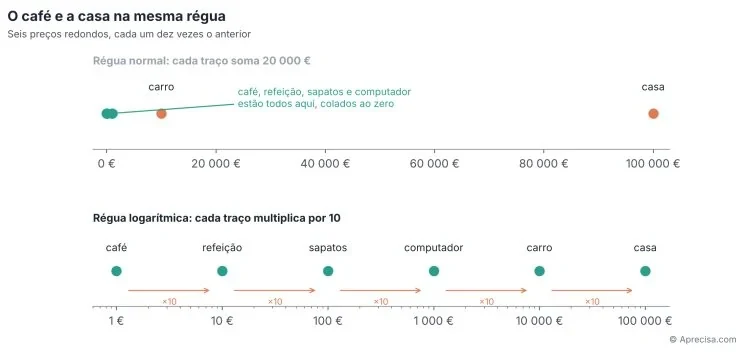
Figure 1 marks six round prices — a coffee at €1, a meal at €10, a pair of shoes at €100, a computer at €1,000, a car at €10,000 and a house at €100,000 — on two rulers of the same length. On the ordinary ruler, at the top, the house takes up the end of the ruler and the other five prices are squeezed together near zero: the coffee, the meal and the shoes cannot be told apart. On the logarithmic ruler, at the bottom, each price is the same distance from the next, because each is worth ten times the previous one. The ordinary ruler shows the house well and hides the rest; the logarithmic one shows everything, but forces you to read distances as multiplications.
II. The ruler we are born with
One might think the logarithmic scale is a mathematicians’ abstraction, useful but artificial. The objection does not survive the human body. In 1834, the physiologist Ernst Weber showed that the smallest difference we notice between two weights is a constant fraction of the weight: if, with 50 grams in the hand, we only notice an increase from 1 gram, with 5,000 grams we will only notice it from about 100. In 1860, Gustav Fechner concluded from this that sensation grows with the logarithm of the stimulus. In 1957, Stanley Stevens corrected the law to a power law, but the essential point remained: we perceive proportions, not differences.
Children start this way. Siegler and Opfer (2003) asked children to mark numbers on a line from 0 to 1,000: in the 2nd year of school, the estimates were logarithmic, with small numbers spread out and large ones crowded together; in the 6th year, they were already linear. Dehaene, Izard, Spelke and Pica (2008) found the same pattern in Mundurukú adults, in the Amazon, with little or no schooling. The linear ruler is learnt at school; the logarithmic one seems to come built in. Varshney and Sun (2013) proposed a reason: in a world where natural stimuli vary by many orders of magnitude, perceiving in proportions minimises the relative error.
The wallet does the same sum. In 1738, Daniel Bernoulli proposed that the utility of wealth is logarithmic: 100 euros change the life of someone who has 1,000 and hardly change that of someone who has a million.
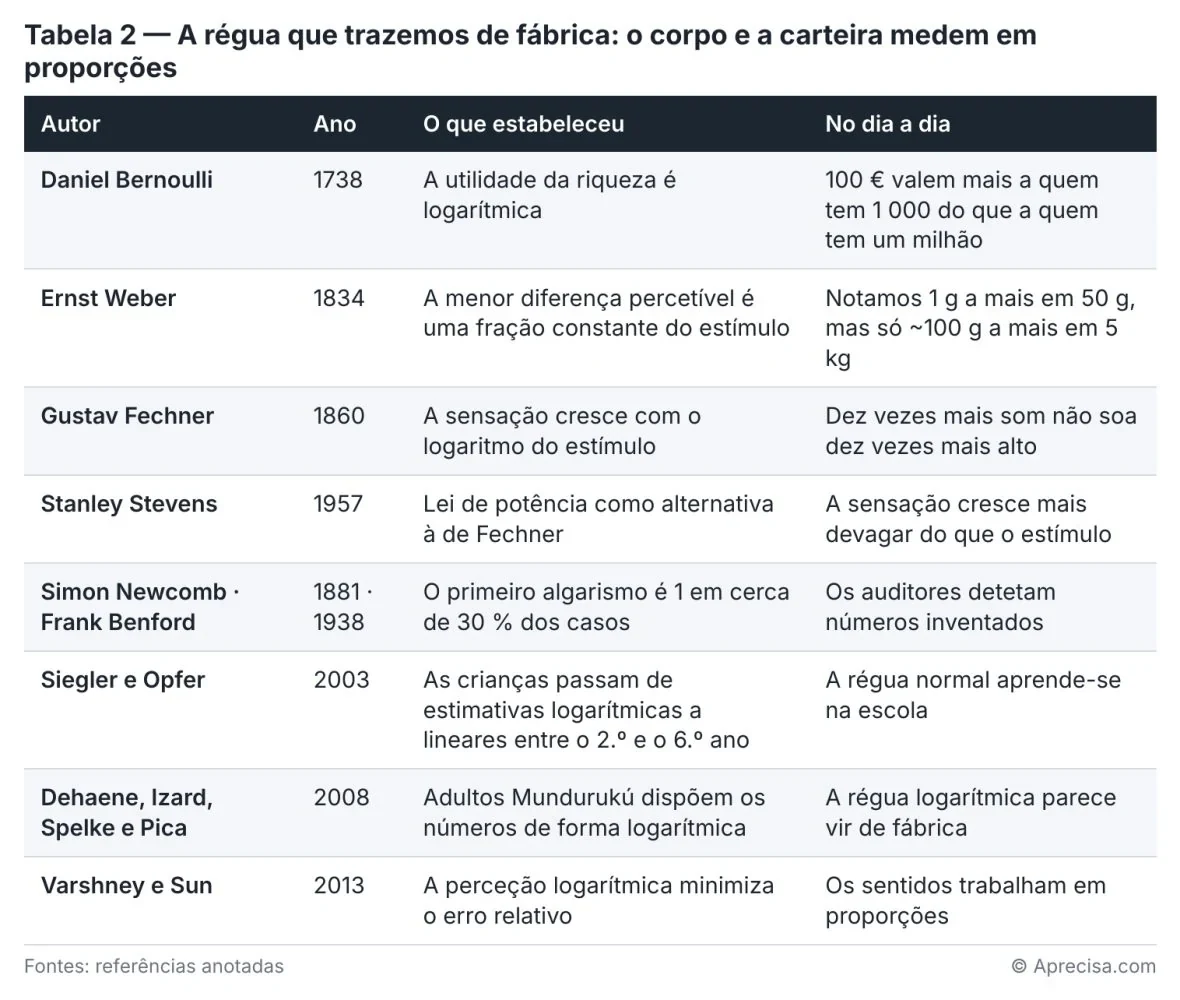
Table 2 brings together the works that established this idea, from Weber to Varshney, with Benford’s law and Bernoulli’s utility. What they have in common is that human beings compare by ratio and not by difference. The logarithmic scale is not foreign to the body; it is foreign to school.
In plain language. In a dark room, lighting a candle makes all the difference. In a room with ten lamps on, the same candle goes unnoticed. The candle is the same; the proportion has changed. Eyes, ears and wallets do the same sum.
III. The misleading objection
If the body already thinks in proportions, why did the residents’ meeting nod? Because school trained us to read numbers as centimetres, and a logarithmic scale is written with small, well-behaved numbers: 55, 65, 5.3, 8.1. The danger is not in the scale; it is in reading it as if it were ordinary.
The error has been measured. Romano, Sotis, Dominioni and Guidi (2020), with 2,000 American adults, obtained 41% correct answers to a simple question about a logarithmic COVID-19 chart, against 84% with the same chart on an ordinary scale. Menge and colleagues (2018) tested 623 professional ecologists: 93% read a linear chart correctly, but only 56% correctly read a chart that was logarithmic on both axes. Heckler, Mikula and Rosenblatt (2013) described similar difficulties among university students.
And yet the logarithmic scale is often the most honest one. Cleveland (1985) advocated it for data spanning several orders of magnitude, and the European Union’s data visualisation guide recommends it when the percentage change matters more than the absolute value. Both things are true at once: it is the most honest ruler for multiplications and the most treacherous for those who do not know it.
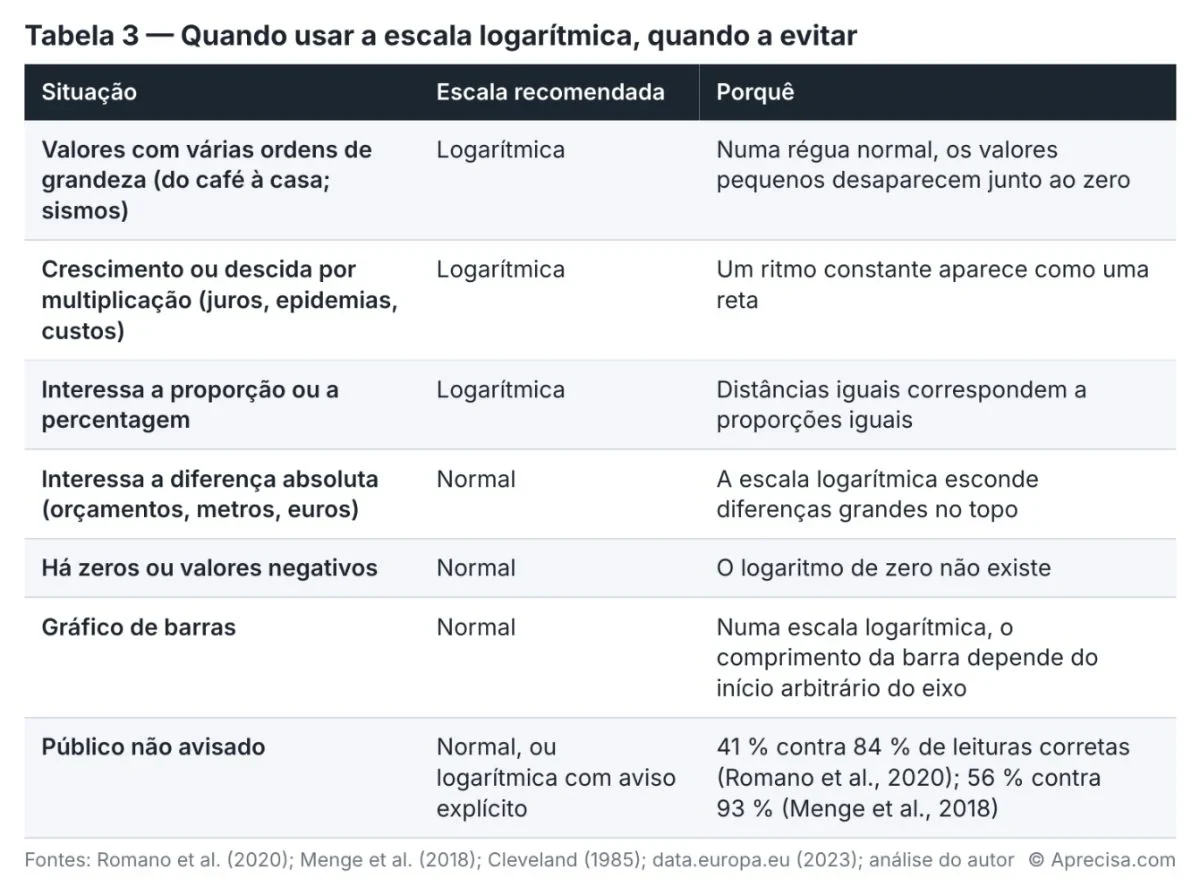
Table 3 sums up when to use the logarithmic scale, when to avoid it and the most common reading errors. The most dangerous error is the one made at the residents’ meeting: reading distances as differences. On a logarithmic ruler, distance measures how many times, never how much.
IV. First layer: telecommunications
In telecommunications, the decibel is not a curiosity; it is the working language. It was born at Bell Laboratories, which in 1929 renamed their “transmission unit” the decibel, in honour of Alexander Graham Bell. The reason is the same as Napier’s: in a link, gains and losses multiply, and in decibels they are added.
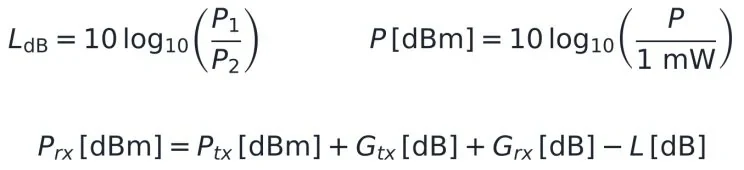
Free-space loss, which Recommendation ITU-R P.525 calculates from the Friis formula (1946), increases by 6 dB every time the distance doubles. A modern single-mode fibre loses about 0.18 dB/km at 1,550 nm, below the maximum of 0.3 dB/km allowed by Recommendation ITU-T G.652. Over a 70 km section between two repeaters of a submarine cable, about 12.6 dB are lost: only about 5.5% of the light reaches the next repeater. Without repeaters, 6,000 km of fibre would lose about 1,080 dB — a fraction so small that no receiver in the universe would detect it. That is why a transoceanic cable is a chain of amplifiers, not a wire.
At the other extreme, at a Wi-Fi access point, the difference between −30 dBm, an excellent signal, and −90 dBm, an unusable signal, is 60 dB: a million times less power, on a scale that goes from “−30” to “−90”. And even the capacity of a channel is logarithmic. Shannon (1948) showed that the maximum capacity is C = B · log2(1 + S/N): with a signal-to-noise ratio of 30 dB, a thousand times, each hertz carries at most about 10 bit/s, and doubling the signal power adds only about one bit per second per hertz.
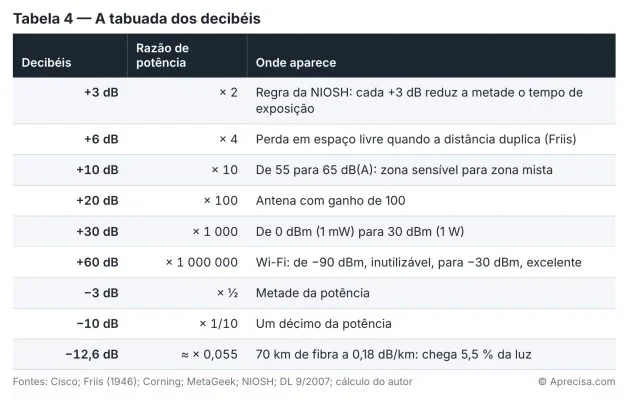
Table 4 is the decibel times table: the equivalences a communications engineer uses in their head and that anyone can learn in an afternoon. The golden rule is the first line: +3 dB is double; −3 dB is half.
V. Second layer: energy and technology
In energy, the logarithmic scale serves to compare what does not fit on the same ordinary ruler. That is why I used it in “O barril de 200 quilos” (The 200-kilo barrel): solar, with 13 tonnes of waste per GWh, and uranium, with 26, are separated by a factor of two; coal, with 88, is more than three times uranium; and the hatched bar of 190 is about fifteen times the bar of 13. On an ordinary ruler, 13 and 26 would stick to zero and 190 would dominate everything. On a logarithmic ruler, each value sits where the proportion puts it.
The logarithmic scale also serves to see what grows or falls by multiplication. The number of transistors in a processor went from 2,308 in 1971 to 58.2 billion in 2021: it doubled every two years, as Gordon Moore predicted in 1965. The price of solar modules has fallen by about 99.6% since 1976, about 20% for each doubling of cumulative production, the learning curve T. P. Wright described for aircraft in 1936. Batteries reached $108/kWh in 2025. On an ordinary chart, these series look like cliffs; on a logarithmic chart, they are straight lines, and the slope of the line is the learning rate. Way and colleagues (2022) used precisely those straight lines to show that energy models systematically underestimated the fall in the cost of solar.
VI. Third layer: the Earth and the sky
Earthquakes. Magnitude has been a logarithm since Richter (1935); the moment magnitude scale of Hanks and Kanamori (1979) kept the principle. Each extra unit means an amplitude ten times larger and about 32 times more energy, according to the United States Geological Survey. The magnitude 5.3 earthquake west of Sines, on 26 August 2024, released about 63 times more energy than the magnitude 4.1 one felt in Greater Lisbon on 19 February 2026. The Kamchatka earthquake, of magnitude 8.8, in July 2025, released about 45 times more energy than the Myanmar one, of 7.7, in March. When an earthquake is revised from 8.0 to 8.8, as happened with Kamchatka, it did not become “a little stronger”: it became about sixteen times more energetic.
Oceans. pH, defined by Sørensen in 1909, is a negative logarithm: each unit less means ten times more acidity. The surface of the ocean has fallen from a pH of about 8.2 to about 8.1 since the pre-industrial era. One tenth looks like nothing; it is about 26 to 30% more acidity. In September 2025, the Potsdam Institute declared the planetary boundary for ocean acidification crossed.
Stars. Stellar magnitude is an inverted logarithm: the larger the number, the less bright the star. In 1856, Norman Pogson established that five magnitudes correspond to a factor of 100 in brightness, about 2.512 per magnitude. Between the end of 2019 and February 2020, Betelgeuse went from about +0.5 to +1.6: it lost about two thirds of its brightness, as NASA confirmed. A “1.1” that is, in fact, almost a third.
Music. An octave higher is double the frequency: the reference A is at 440 Hz, under the ISO 16 standard, and the next A at 880 Hz. Each semitone multiplies the frequency by about 1.06. A piano keyboard is a logarithmic ruler: equally spaced keys, equal multiplications.
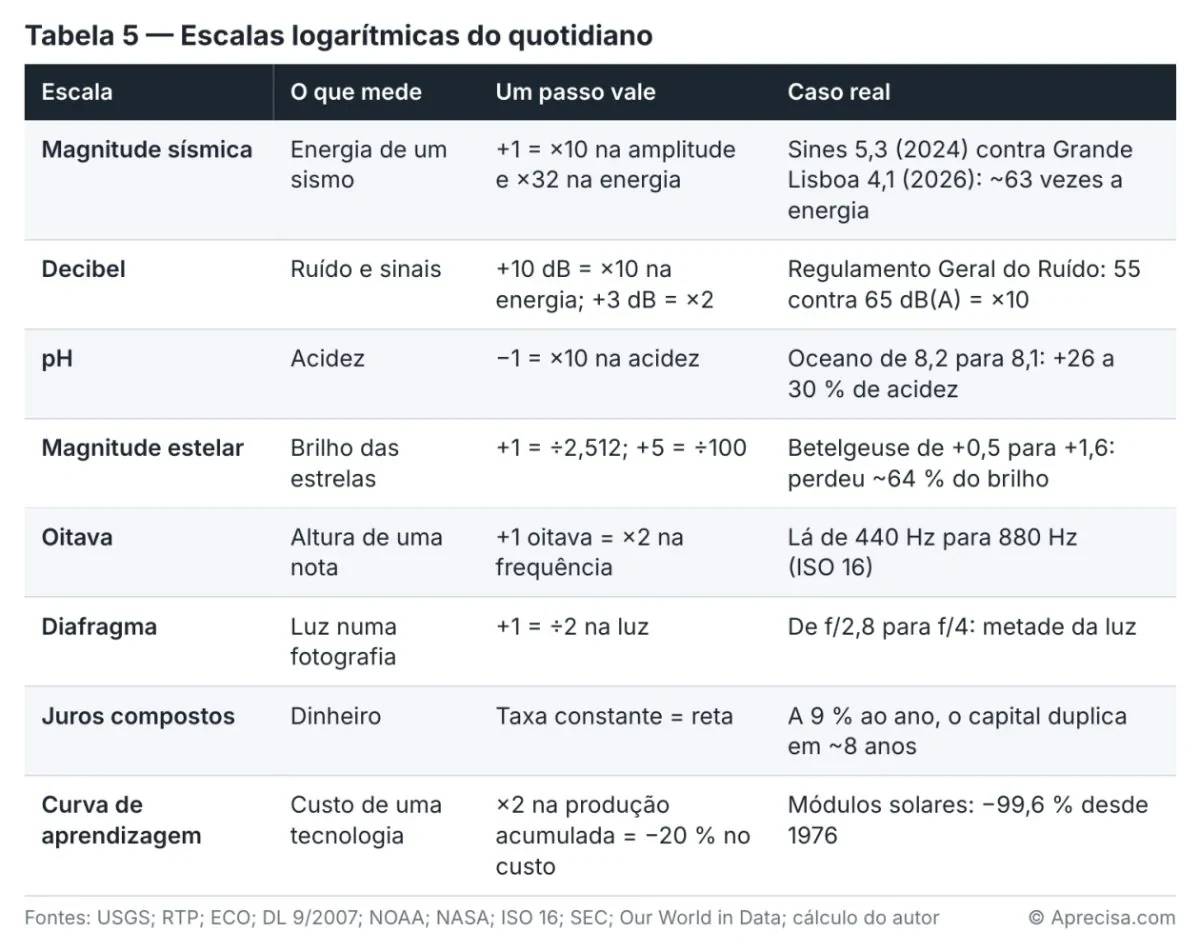
Table 5 brings together everyday logarithmic scales and shows, for each, what one step is worth and a recent real case. It is the table to keep: whoever has it in mind will watch the news with different eyes.
VII. Three practical cases
Because the scale, when misread, turns up in the noise report, in the chart on the news and in the link budget.
Case 1 — The bar that made “only ten more”. The Regulamento Geral do Ruído (Portugal’s general noise regulation) sets, for sensitive zones, 55 dB(A) for the day-evening-night indicator and 45 dB(A) at night; for mixed zones, 65 and 55 dB(A). The numbers look like neighbours, but the sound energy does not: 65 dB(A) is ten times more energy than 55, and 85 dB(A) would be a thousand times more. The European directive on noise at work sets action values of 80 and 85 dB(A) and a limit of 87 dB(A): from 80 to 87 dB, the energy increases fivefold. NIOSH recommends that, for every 3 dB above 85 dB(A), the exposure time be halved. The bar owner was not 18% over the limit; he was ten times over.
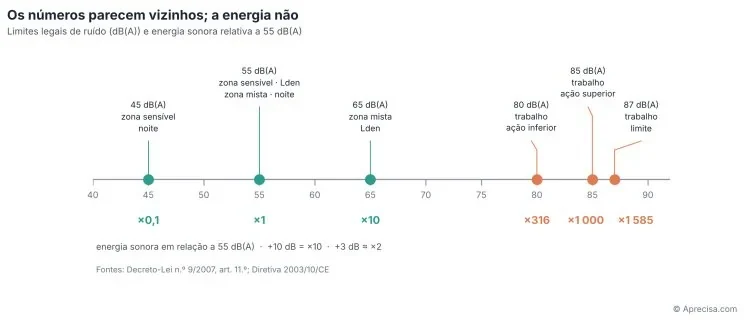
Figure 2 places on the same ruler the legal noise limits that apply in Portugal: the 45 and 55 dB(A) of sensitive zones, the 55 and 65 dB(A) of mixed zones and the 80, 85 and 87 dB(A) of the directive on noise at work. Below each value is the sound energy relative to 55 dB(A). The numbers on the ruler look close — 55, 65, 85 — but the energy does not: 65 dB(A) is ten times more energy than 55, and 85 dB(A) is a thousand times more. It is the best example of how a logarithmic scale can reassure, without reason, those who read it as if it were ordinary.
Case 2 — The curve that “explodes”. Everything that always grows in the same proportion — interest, epidemics, transistors — appears as a straight line on a logarithmic scale. The rule of 72, promoted by the American markets authority, says that at 9% a year capital doubles in about 8 years. In 2020, John Burn-Murdoch, of the Financial Times, popularised logarithmic COVID-19 charts for precisely that reason: a constant rhythm is a straight line, and a slowdown is a line that bends.
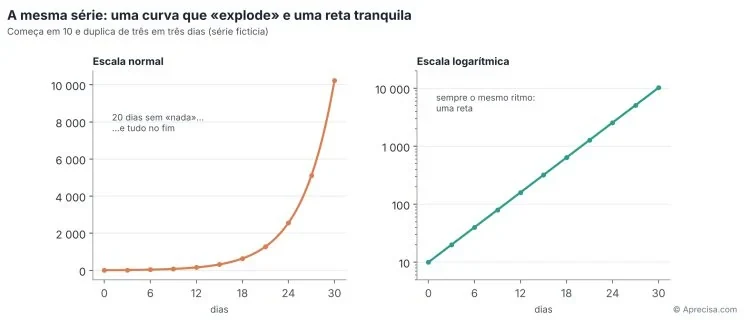
Figure 3 shows a fictitious series that starts at 10 and doubles every three days for 30 days, reaching 10,240. On the left, on an ordinary scale, the first twenty days seem to have nothing and everything seems to happen at the end: it is the curve that “explodes”. On the right, on a logarithmic scale, the same series is a perfect straight line, and it becomes clear that nothing changed in the rhythm — it always doubled at the same pace. The ordinary scale shows the size of the problem; the logarithmic one shows the rhythm. To decide in time, the rhythm is what counts.
Case 3 — The student and the link budget. Ask a student to calculate the power received on a link: a 1 W transmitter, two antennas with gains of 100 and 1,000 times, and a propagation loss of one in ten quadrillion (1016). Along the path of “ordinary” numbers, they multiply four numbers with many zeros and get a decimal place wrong at the second step. Along the path of decibels, they write +30 dBm, +20 dB, +30 dB and −160 dB, and add: −80 dBm, that is, ten picowatts. One line. It is not a trick; it is the discovery that the structure of the problem — gains and losses that multiply — is the structure of the logarithm. Napier, once again, saving work four centuries later.
In plain language. A water lily that doubles in size every day covers half the pond the day before it covers all of it. Whoever looks at the pond only sees the problem on the last day. Whoever looks at the rhythm sees it from the first.
From this comes a five-step reading method:
- 1. Look at the axis. If the marks are 1, 10, 100, 1,000, the scale is logarithmic.
- 2. Count the jumps. Each jump from mark to mark is a multiplication by ten.
- 3. Read distances as multiplications. The same distance is always the same number of times.
- 4. Read straight lines as rhythms. A straight line is constant growth; the slope is the rate.
- 5. Go back to the numbers. Before concluding, convert to absolute values: “ten times more” than what?
VIII. The lawyer and the treasurer
When the meeting is over, the lawyer and the treasurer stay behind, tidying up papers. She asks, half smiling: “In court, three decibels more at night — is that a lot or a little?” He shrugs: “I learnt logarithms in the 12th year. I don’t remember a thing.” She laughs: “I didn’t even get that far. I did Humanities.”
Without knowing it, the two of them are describing the Portuguese school path. The logarithm proper — definition, rules, logarithmic function — is part of Matemática A (the main mathematics course) in the 12th year, the subject of the Science and Technology and the Socio-economic Sciences tracks, through which almost all future economists and engineers pass. The workbook that the Direção-Geral da Educação (Portugal’s Directorate-General for Education) prepared for the 2025/2026 pilot classes already applies it to pH and decibels. In the Languages and Humanities track, where many future lawyers come from, the subject Matemática Aplicada às Ciências Sociais (Mathematics Applied to the Social Sciences) compares linear, exponential and logarithmic growth and deals with interest and inflation, but without calculating logarithms. Those who decide on noise, earthquakes or statistical evidence may, therefore, never have worked with a logarithmic scale.
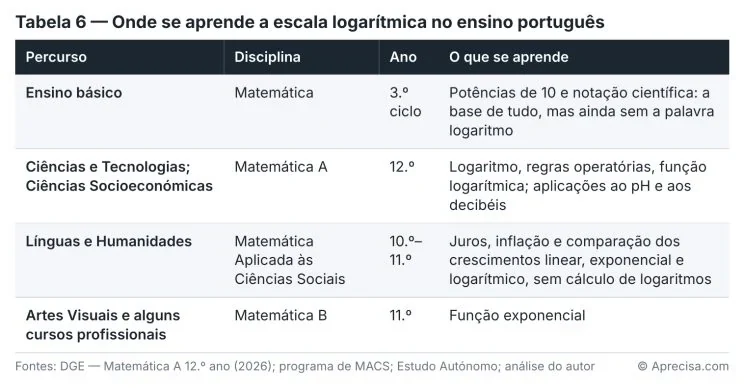
Table 6 shows in which year and in which subject the logarithmic scale appears in Portuguese education. It is not a criticism of the school: it is a warning to those who, years later, will use these numbers to decide.
What the treasurer needs to remember. The economist lives on proportions. If prices rise by 10% and then fall by 10%, they do not return to the start: 1.10 × 0.90 = 0.99, 1% is lost. In logarithms, the rise and the fall are the same size, and that is why economists measure growth with logarithms: small differences of logarithms are, almost exactly, percentage changes. The residents’ reserve fund, invested at 3% a year, doubles in about 72 ÷ 3 = 24 years, by the rule of 72. Prices, with 3% inflation, do too. GDP per capita ranges, between countries, from a few hundred to more than a hundred thousand dollars: only on a logarithmic ruler do they all fit on the same chart without the poorest disappearing near zero. And when an economist says that demand has an “elasticity of −2”, they are saying that, if the price rises by 1%, demand falls by about 2% — a relationship between proportions, which on charts reads as a straight line on a logarithmic scale.
What the lawyer needs to know. The jurist decides with numbers that others have measured, and many of those numbers come on logarithmic scales.
- Noise. The Regulamento Geral do Ruído, in Article 13, sets the nuisance criterion: the difference between the noise with and without the activity may not exceed 5 dB(A) by day, 4 dB(A) in the evening and 3 dB(A) at night. Three decibels is double the sound energy. The legislator wrote “double” in decibels. Whoever reads “only three more” as a minimal tolerance is misreading the law.
- Environment. The emission limit values for waste water discharges in Decreto-Lei n.º 236/98 (Portuguese Decree-Law No. 236/98) allow a pH between 6.0 and 9.0. It looks like a narrow range. Between pH 6 and pH 9 there is a difference in acidity of a thousand times.
- Interest on interest. Article 560 of the Código Civil (Portuguese Civil Code) establishes that, for interest due to produce interest, an agreement made after it falls due or a judicial notification of the debtor is required; paragraph 2 adds that “only interest corresponding to a minimum period of one year may be capitalised”; and paragraph 3 sets these restrictions aside when they contradict particular rules or usages of commerce. The caution is justified: at 10% a year for ten years, simple interest adds up to 100% of the capital; compound interest multiplies it by 1.110 ≈ 2.59, that is, 159% more. The difference between adding and multiplying is the difference between the two sums.
- Expert evidence. The guidelines of the European Network of Forensic Science Institutes (ENFSI, 2015) grade the strength of evidence by the likelihood ratio: from 10 to 100, moderate support; from 100 to 1,000, moderately strong; from 1,000 to 10,000, strong; from 10,000 to a million, very strong; above a million, extremely strong. Each verbal step is a multiplication by ten, or more. “Strong” and “very strong” are not two adjectives close to each other: they can be separated by a factor of a hundred.
- Fraud. Benford’s law — the digit 1 appears as the first digit in about 30% of real numbers — is used as an indication in tax and accounting audits. It is an indication, not proof, and it has known limits: Nigrini, one of the references in the field, pointed out in 2020 that it cannot be used to prove electoral fraud when polling stations are of similar size.
- Fines. The General Data Protection Regulation, in Article 83, allows fines of up to 10 million euros or 2% of worldwide annual turnover (paragraph 4) and, for the most serious infringements, up to 20 million euros or 4% (paragraph 5), whichever is higher. Between a small business and a multinational there are four to six orders of magnitude; the principle of proportionality is, at bottom, reasoning in proportions.
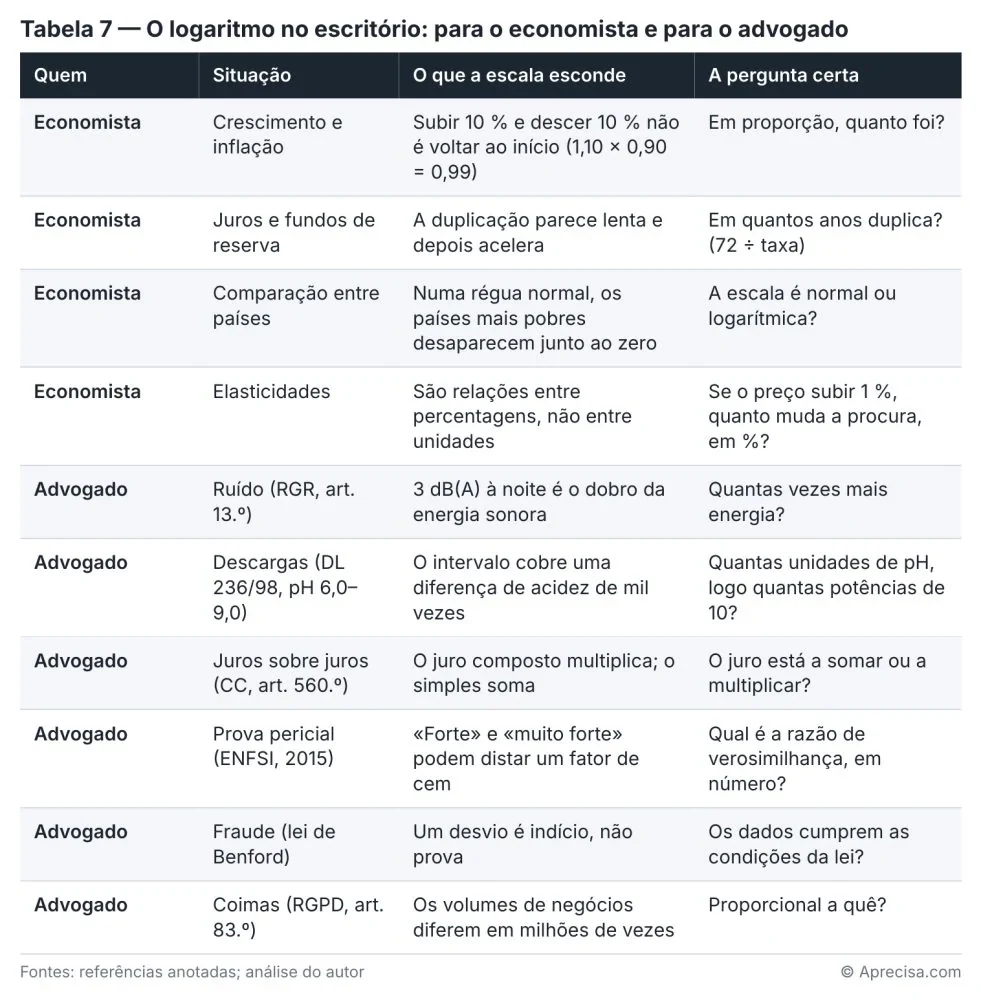
Table 7 brings together, for the economist and for the lawyer, the situations in which the logarithmic scale appears, what it can hide and the question worth asking before deciding. It is the table to take to the office.
In plain language. Imagine two savings accounts. In the first, the bank adds 100 euros every year. In the second, it multiplies the balance by 1.1. In the first few years they look the same; after thirty years, the second has far more than double. The law on anatocism (interest on interest), the noise criterion and the scale of expert evidence exist because someone realised that adding and multiplying are not the same thing.
IX. The residents’ meeting, revisited
I go back to the room, because the remark from the back deserves to be taken seriously — it is better than it seemed.
It is true: yesterday’s earthquake was “only” 5.3. But notice what the remark concedes without realising it: nobody in the room needed to know what a logarithm is to feel the building shake, and that earthquake released about sixty times more energy than the 4.1 one in the winter. The neighbours’ ears did not need Napier’s tables either to realise that the bar was making ten times more noise than it should. The body measured well; what measured badly was the reading.
The logarithmic scale does not ask for opinions. It works, like the imaginary numbers of the octopus, regardless of the faith of whoever reads it. What is asked of those who decide — the building manager, the lawyer, the treasurer, the municipal inspector, the journalist, the engineer, the judge — is a single question, asked before any conclusion: does this ruler add or multiply?
At the next meeting, the lawyer will no longer take notes in silence. When the bar owner says “only ten more”, she will answer, without raising her voice: “Ten decibels, sir. Ten times.” And the treasurer will add, from his spreadsheet: “And at night, three is already double.”
An ordinary ruler asks how much. A logarithmic ruler asks how many times. Good decisions need both questions.
Fewer centimetres. More proportions.
In plain language. The next time you hear “it went up one degree”, ask: one degree of what? On a thermometer, it is little. In an earthquake, it is thirty-two times. In acidity, it is ten times. The right question is always the same: does this ruler add or multiply?
Gaspar do Amaral
Illustrations and tables: © Aprecisa.com, AI-assisted.
Methodological note
What this page is. A translation of the article the author published on LinkedIn on 10 October 2026; the full Portuguese version is on this site. The cover, the two formula panels, the three figures and the seven tables are the original images, with their texts in Portuguese; the captions translate their content. The exponents and subscripts (103, log2) that the LinkedIn version had lost are restored. The annotated references are listed in the original order: A. Starting point (1–3); B. Scientific and institutional literature (4–36); C. School, law and economics (37–46); D. Real cases and news (47–78). In group D, the description of each source, written in Portuguese in the original, is translated in the annotation. The author’s own methodological note follows.
Everything in this essay that is not published data, but a calculation or construction by the author, is identified below.
1. Earthquakes. Energy ratio = 101.5 × ΔM and amplitude ratio = 10ΔM (USGS). Sines 5.3 and Alenquer 4.1: ΔM = 1.2, energy 101.8 ≈ 63, amplitude 101.2 ≈ 16. Kamchatka 8.8 and Myanmar 7.7: ΔM = 1.1, energy 101.65 ≈ 45. Revision from 8.0 to 8.8: 101.2 ≈ 16.
2. Noise. Energy ratio = 10ΔL/10. 65 − 55 = 10 dB → 10; 85 − 55 = 30 dB → 1,000; 87 − 80 = 7 dB → 100.7 ≈ 5; +3 dB → 100.3 ≈ 2.
3. pH. Acidity ratio = 10ΔpH. 8.2 − 8.1 = 0.1 → 100.1 ≈ 1.26, or +26%. NOAA’s figure of “about 30%” corresponds to a fall slightly greater than 0.1.
4. Stars. Brightness ratio = 10−0.4 × Δm. Betelgeuse from +0.5 to +1.6: Δm = 1.1 → 10−0.44 ≈ 0.36, that is, it lost about 64% of its brightness. 1001/5 ≈ 2.512.
5. Music. Semitone = 21/12 ≈ 1.059.
6. Transistors. 58.2 × 10⁹ ÷ 2,308 ≈ 2.5 × 10⁷; log2 ≈ 24.6 doublings in 50 years, or one doubling every 2.03 years, a value matching the published one.
7. Residents’ meeting. 65 ÷ 55 ≈ 1.18, that is, “18% above” if the scale were ordinary; in energy, 10(65 − 55)/10 = 10.
8. Case 3, link budget. 1 W = +30 dBm; gain ×100 = +20 dB; gain ×1,000 = +30 dB; loss ×10−16 = −160 dB. Sum: 30 + 20 + 30 − 160 = −80 dBm = 10−8 mW = 10−11 W = 10 pW. Values chosen by the author to illustrate the method, not taken from a real link.
9. Chapter VIII. 1.10 × 0.90 = 0.99. Rule of 72: 72 ÷ 3 = 24 years (the exact value is ln 2 ÷ ln 1.03 ≈ 23.4). Simple interest at 10% for 10 years: 10 × 10% = 100%; compound: 1.110 ≈ 2.594. pH 6 to 9: 109 − 6 = 1,000. Nuisance criterion: 103/10 ≈ 2.0; 105/10 ≈ 3.2. The GDP per capita values and the elasticity example are illustrative.
10. Telecommunications. 70 km × 0.18 dB/km = 12.6 dB → 10−1.26 ≈ 0.055, or 5.5%. 6,000 km × 0.18 dB/km = 1,080 dB. −30 − (−90) = 60 dB → 106. Doubling the distance in free space: 20 × log10(2) ≈ 6.02 dB. Shannon with 30 dB: log2(1 + 1,000) ≈ 9.97 bit/s/Hz; doubling S/N adds log2(2) = 1 bit/s/Hz, approximately, for high signal-to-noise ratios.
11. Benford’s law (Table 2). P(d) = log10(1 + 1/d): P(1) ≈ 30.1%, P(9) ≈ 4.6%.
12. Figure 1. Built by the author with six round, illustrative prices (€1 to €100,000), chosen to form a progression with a ratio of 10. They are not market prices.
13. Figure 2. Built by the author with the limits of the Regulamento Geral do Ruído (Decreto-Lei n.º 9/2007, Article 11) and of Directive 2003/10/EC. The relative energy is 10(L − 55)/10.
14. Figure 3. Fictitious series built by the author: N(t) = 10 × 2t/3, with t in days, from 0 to 30. It does not represent real data from any epidemic.
15. Cover. Drawing by the author: a logarithmic ruler from 1 to 10,000 with the multiplications by ten between marks, a series that grows by multiplication and appears as a straight line, and three formulas from the text.
References
- Amaral, G. (10/2026), O barril de 200 quilos, LinkedIn — the logarithmic ruler of waste per GWh that prompted this essay.
- Amaral, G. (15/07/2026), O polvo não dispensa a química — sobre a realidade dos números imaginários, LinkedIn — the article of which this one is the continuation, in the same series.
- Amaral, G. (10/2026), Duas horas ao fim da tarde, LinkedIn — essay on the adequacy of the Iberian power system.
- Napier, J. (1614), Mirifici logarithmorum canonis descriptio, Edimburgo — the first table of logarithms: multiplications turned into sums.
- Briggs, H. (1624), Arithmetica logarithmica, Londres (reconstrução de D. Roegel, 2011) — base-10 logarithms with 14 decimal places.
- Bernoulli, D. (1738), Specimen theoriae novae de mensura sortis; trad. ingl. Econometrica 22(1), 1954 — the utility of wealth is logarithmic.
- Newcomb, S. (1881), Note on the frequency of use of the different digits in natural numbers, American Journal of Mathematics 4(1) — the first pages of the tables of logarithms wore out more.
- Benford, F. (1938), The law of anomalous numbers, Proceedings of the American Philosophical Society 78(4) — the first digit is 1 in about 30% of cases.
- Weber, E. H. (1834), De pulsu, resorptione, auditu et tactu, Leipzig — the smallest perceptible difference is a constant fraction of the stimulus.
- Fechner, G. T. (1860), Elemente der Psychophysik, Leipzig — sensation grows with the logarithm of the stimulus.
- Stevens, S. S. (1957), On the psychophysical law, Psychological Review 64(3) — a power law as an alternative to Fechner’s law.
- Dehaene, S., Izard, V., Spelke, E. e Pica, P. (2008), Log or linear?, Science 320 — Mundurukú adults arrange numbers logarithmically.
- Siegler, R. e Opfer, J. (2003), The development of numerical estimation, Psychological Science 14(3) — from logarithmic to linear estimates between the 2nd and 6th year of school.
- Varshney, L. e Sun, J. (2013), Why do we perceive logarithmically?, Significance 10(1) — logarithmic perception minimises the relative error.
- Richter, C. (1935), An instrumental earthquake magnitude scale, BSSA 25(1) — magnitude as the logarithm of amplitude.
- Hanks, T. e Kanamori, H. (1979), A moment magnitude scale, Journal of Geophysical Research 84(B5) — the moment magnitude scale used today.
- Sørensen, S. P. L. (1909), Enzymstudien II, Biochemische Zeitschrift 21 (excerto em inglês) — definition of pH.
- Pogson, N. (1856), Magnitudes of thirty-six of the minor planets, MNRAS 17 — factor of 2.512 per stellar magnitude.
- Shannon, C. (1948), A mathematical theory of communication, Bell System Technical Journal 27 — information and capacity measured with logarithms.
- Bode, H. W. (1945), Network Analysis and Feedback Amplifier Design, Van Nostrand — Bode plots on a logarithmic frequency axis.
- Friis, H. T. (1946), A note on a simple transmission formula, Proceedings of the IRE 34(5) — received power falls with the square of the distance.
- ITU-R, Recomendação P.525-5 (11/2024), Calculation of free-space attenuation — free-space attenuation in decibels.
- ITU-T, Recomendação G.652 (08/2024), Characteristics of a single-mode optical fibre and cable — maximum of 0.3 dB/km at 1,550 nm for G.652.D.
- Martin, W. H. (1929), Decibel — the name for the transmission unit, Bell System Technical Journal 8 — the origin of the decibel.
- Moore, G. (1965), Cramming more components onto integrated circuits, Electronics 38(8) — Moore’s law.
- Wright, T. P. (1936), Factors affecting the cost of airplanes, Journal of the Aeronautical Sciences 3(4) — the learning curve.
- Way, R., Ives, M., Mealy, P. e Farmer, J. D. (2022), Empirically grounded technology forecasts and the energy transition, Joule 6(9) — cost curves on a logarithmic scale for more than 50 technologies.
- Romano, A., Sotis, C., Dominioni, G. e Guidi, S. (2020), The scale of COVID-19 graphs affects understanding, attitudes, and policy preferences, Health Economics 29(11) — 41% against 84% correct answers.
- Menge, D. et al. (2018), Logarithmic scales in ecological data presentation may cause misinterpretation, Nature Ecology & Evolution 2 — 93% against 56% correct readings.
- Heckler, A., Mikula, B. e Rosenblatt, R. (2013), Student accuracy in reading logarithmic plots, IEEE Frontiers in Education — difficulties of university students.
- Cleveland, W. e McGill, R. (1984), Graphical perception, Journal of the American Statistical Association 79 — how the eye reads charts.
- Cleveland, W. (1985), The Elements of Graphing Data, Wadsworth — the case for logarithmic scales across many orders of magnitude.
- data.europa.eu (2023), Logarithmic y axes, guia de visualização de dados da UE — the EU’s data visualisation guide: when to use logarithmic axes.
- OMS Europa (2018), Environmental Noise Guidelines for the European Region — WHO Europe guidelines on environmental noise.
- Diretiva 2003/10/CE (ruído no trabalho) — Directive 2003/10/EC (noise at work): action values of 80 and 85 dB(A) and limit of 87 dB(A).
- NIOSH (1998), Occupational Noise Exposure, Revised Criteria — 85 dB(A) over 8 h and the 3 dB rule.
- DGE (2026), Matemática A, 12.º ano — Funções exponenciais e logarítmicas, tarefas das turmas-piloto 2025/2026 — logarithms applied to pH and sound level (Directorate-General for Education; Matemática A, 12th year; pilot classes).
- DGE, Programa de Matemática Aplicada às Ciências Sociais, 10.º e 11.º anos (ensino recorrente) — financial models and comparison of linear, exponential, logarithmic and logistic growth (programme for the 10th and 11th years, adult education).
- DGE, Estudo Autónomo — Matemática 12.º ano: função exponencial e função logarítmica — self-study material for 12th-year mathematics: exponential and logarithmic functions.
- Decreto-Lei n.º 9/2007, Regulamento Geral do Ruído, art. 13.º, n.º 1, al. b) — Portugal’s general noise regulation, Article 13(1)(b): nuisance criterion of 5, 4 and 3 dB(A).
- APA — Resultados de pontos de descarga, com o Anexo XVIII do Decreto-Lei n.º 236/98 — Portuguese Environment Agency, results at discharge points, with Annex XVIII of Decree-Law No. 236/98: pH, Sørensen scale, 6.0–9.0.
- Código Civil, art. 560.º (Anatocismo), n.ºs 1 a 3 — Portuguese Civil Code, Article 560 (anatocism), paragraphs 1 to 3: agreement after the due date or judicial notification; capitalisation only of interest covering at least one year; exception for commercial rules and usages (no link in the original).
- Acórdão que cita o art. 560.º, n.º 1, do Código Civil — court ruling citing Article 560(1) of the Portuguese Civil Code.
- ENFSI (2015), Guideline for Evaluative Reporting in Forensic Science — verbal equivalents of the likelihood ratio by orders of magnitude.
- Regulamento (UE) 2016/679 (RGPD), art. 83.º, n.ºs 4 e 5 — General Data Protection Regulation, Article 83(4) and (5): fines of up to €10 million or 2% and up to €20 million or 4% of worldwide annual turnover.
- Portal Europeu da Justiça — Taxas de juro, Portugal — European e-Justice Portal, interest rates in Portugal: “only interest corresponding to a minimum period of one year may be capitalised”, except under special rules.
- USGS — How much bigger is a magnitude 8.7 earthquake than a 5.8? — 10 times the amplitude and about 32 times the energy per unit.
- USGS (2025) — The Kamchatka earthquake — magnitude 8.8 on 29 July 2025.
- Business Standard / AP (30/07/2025) — The strongest earthquakes ever recorded — magnitude revised from 8.0 to 8.8.
- USGS (28/03/2025) — Magnitude 7.7 earthquake in Myanmar.
- IPMA — Frequently asked questions on seismology (Portuguese Institute for Sea and Atmosphere) — magnitude and intensity.
- RTP (26/08/2024) — Magnitude 5.3 earthquake felt in several parts of Portugal — west of Sines.
- ECO (19/02/2026) — Magnitude 4.1 earthquake felt in Greater Lisbon.
- AEA (24/06/2025), Environmental noise in Europe 2025 — European Environment Agency — about 92 million people exposed to road noise above 55 dB Lden.
- AEA (24/06/2025) — European Environment Agency — more than 20% of Europeans exposed to harmful noise levels.
- Decreto-Lei n.º 9/2007, Regulamento Geral do Ruído (texto consolidado) — Portugal’s general noise regulation (consolidated text) — 55/45 and 65/55 dB(A).
- EU-OSHA — Diretiva 2003/10/CE — Directive 2003/10/EC — 80, 85 and 87 dB.
- NIOSH/CDC — Noise — each extra 3 dB halves the exposure time.
- NOAA — Origin and impacts of ocean acidification — pH from 8.2 to 8.1, about 30% more acidity.
- PIK (24/09/2025) — Seven of nine planetary boundaries crossed — ocean acidification.
- Euronews (24/09/2025) — The oceans have crossed the acidification boundary.
- NASA (13/08/2020) — The dimming of Betelgeuse — it lost more than two thirds of its brightness.
- Sky & Telescope (14/02/2020) — Betelgeuse at +1.5 or +1.6.
- Fórum Económico Mundial (08/04/2020) — World Economic Forum — interview with John Burn-Murdoch: why the logarithmic scale.
- LSE (19/05/2020) — The public does not understand the logarithmic COVID-19 charts.
- ISO 16 — Reference tuning — A at 440 Hz.
- LibreTexts — Musical intervals and temperament — octave and semitone.
- Phillip Reeve (27/08/2025) — f-numbers and light transmission — each stop halves the light.
- Cisco — RF power values — 0 dBm = 1 mW; +3 dB = double.
- MetaGeek — Understanding RSSI — from −30 dBm to −90 dBm.
- Corning (2024) — SMF-28 Ultra data sheet — 0.18 dB/km at 1,550 nm.
- Submarine Networks (18/09/2020) — Submarine repeater technology — repeaters every 60 to 70 km.
- Investor.gov (SEC) — What is compound interest? — the rule of 72.
- Our World in Data (15/04/2024) — Moore’s law over 50 years — from 2,308 to 58.2 billion transistors.
- Our World in Data — Why did renewables become so cheap so fast? — solar modules 99.6% cheaper; 20% per doubling.
- BloombergNEF (09/12/2025) — Batteries at $108/kWh.
- VoxEU/CEPR (17/09/2018) — Benford’s law in detecting tax fraud.
- Nigrini (04/12/2020) — The limits of Benford’s law in elections.
The discussion is on LinkedIn (in Portuguese)
Comments on this text are made on LinkedIn, where the article was shared in Portuguese. You are welcome to write in English. Agree, disagree or add data: every well-founded objection receives a reply.
Gaspar do Amaral · Original in Portuguese of 10 October 2026, published on this site; translation issued on 27 October 2026 · Figures and tables © Aprecisa.com · AI-assisted