 ← Grupo Aprecisa · Connecting those who know with those who need
Energy and the electricity system
The 200-kilo barrel
Solar, nuclear and the same ruler — why the best decision comes from inevitabilities, not preferences
Gaspar do Amaral · 10 October 2026
Translated from the Portuguese original. This version was issued on 27 October 2026.
On this site, this article has been
One barrel, two propagandas
The energy debate lives on strong images. One of the most recent is that of a barrel: if the polluter-pays principle were applied rigorously, every solar panel should come with 200 kilos of toxic mining sludge. The image is by the Swiss physicist Walter Rüegg, in an article published on LinkedIn on 8 October 2026, and it sums up an argument that is circulating more and more: solar would be as dirty as nuclear, or dirtier.
On the other side, the symmetrical argument has been circulating for decades: nuclear would be an “old kettle”, its waste would have no solution and its story would be over. In the same discussion, someone even claimed that the German repository at Schacht Konrad cost 20 million euros; it cost more than three hundred times that. The two propagandas have one thing in common: they pick the numbers that suit them and change ruler when they change technology.
This essay is not a reply to an author. It proposes a method and a decision grid. The method is to measure all technologies with the same ruler. The grid is to decide on the basis of the physical and industrial inevitabilities that neither propaganda can deny, and not on the basis of preferences. The 200-kilo barrel serves as an exemplary case, because it shows, in a single argument, how a right conclusion can rest on a wrong proof.
In plain language: Imagine two people arguing about which car uses less. One of them counts the petrol of the neighbour’s car and also the tyres, the insurance and the garage; for their own car, they count only the petrol. They always win the argument, but not because they are right. This essay takes a single ruler and measures both cars with it.
An exemplary case
The barrel argument has five pieces. The first is energy density: matching 1 GW of baseload would require about 50 million square metres of panels at mid-latitudes. The second is materials: solar would require up to fifty times more copper than a thermal power station, each module would be associated with more than 200 kg of tailings, and the potential toxicity per GWh would be of the same order as that of nuclear waste. The other three are system conclusions: fossil fuels are not retreating, what counts is the cost of a system that is reliable at any hour, and nuclear is expensive for industrial reasons, not physical ones. Table 1 sets each of these claims, current in the debate, against the published evidence.
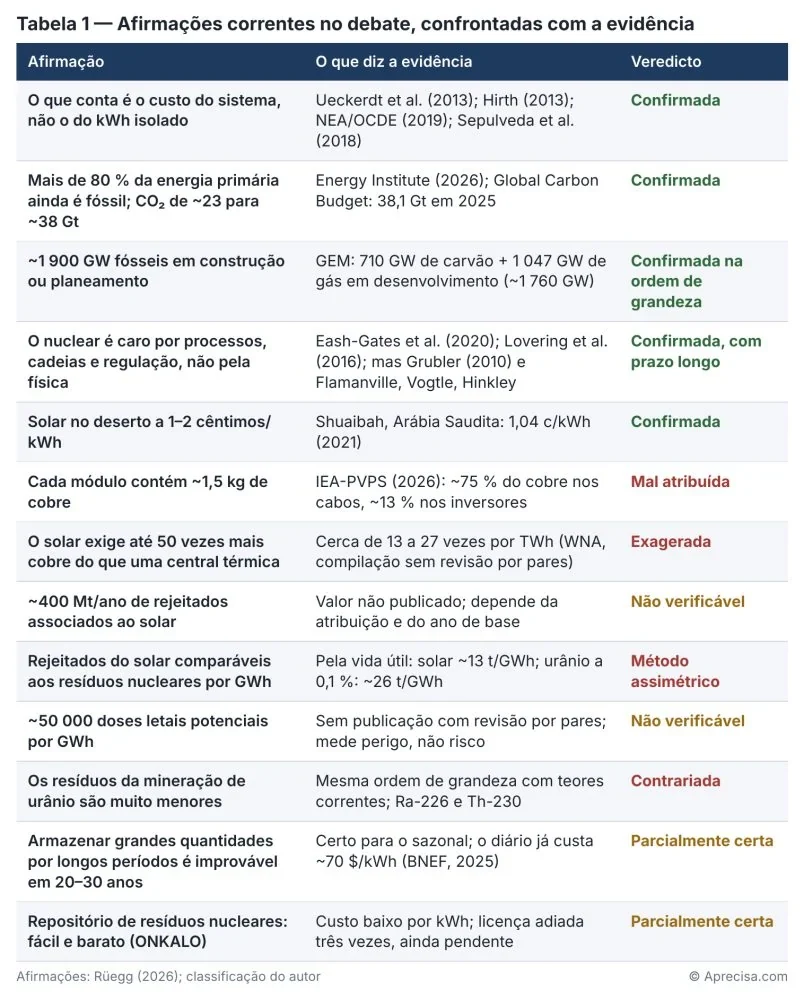
Table 1 shows a clear pattern. The claims about the system — cost, fossil persistence, the constraints on nuclear — are confirmed. The claims about the materials of solar, which are what is new in the argument, are either misattributed, or not verifiable, or dependent on the counting method.
What the evidence confirms
The cost that counts is the cost of the system. Ueckerdt, Hirth, Luderer and Edenhofer (2013) showed that, with 40% wind power, integration costs reach about 60 €/MWh, as much as the levelised cost of the wind power itself. Hirth (2013) showed that the market value of variable generation falls as its share grows. The OECD Nuclear Energy Agency (2019) estimated that the system costs of variable generation rise from less than 10 $/MWh at a 10% share to more than 50 $/MWh at 75%. Sepulveda, Jenkins, de Sisternes and Lester (2018) concluded that having firm low-carbon resources reduces the cost of a decarbonised system by between 10% and 62%. It is the same thesis I defended in «Duas horas ao fim da tarde» (“Two hours in the late afternoon”).
Fossil fuels are not retreating. The Global Carbon Project estimated 38.1 billion tonnes of fossil CO₂ in 2025, a new record. The International Energy Agency recorded record coal consumption of about 8,845 million tonnes in the same year. Global Energy Monitor counts 710 GW of coal and 1,047 GW of gas in development. The order of magnitude invoked in the debate is right.
Nuclear is not expensive because of physics. Eash-Gates and colleagues (2020), at MIT, broke down the cost of American power stations: more than half of the increase between 1976 and 1987 was due to indirect costs, and on-site productivity came to be thirteen times lower than planned. Lovering, Yip and Nordhaus (2016), with 349 reactors in seven countries, found no inevitable trend of escalation: South Korea brought costs down with series construction.
Energy density counts. Van Zalk and Behrens (2018), with 177 power densities, confirm that non-renewable sources occupy about a thousand times less area per unit of power. Solar is, however, the only source whose density is improving.
Copper is a real constraint. The International Energy Agency (2025) forecasts a shortfall of about 30% in copper supply by 2035, with reserves increasingly concentrated. Tailings are also a real risk: Franks and colleagues (2021) showed that about 10% of the declared dams had stability problems. In February 2025, a breach at a copper mine in Zambia released about 50 million litres of acidic tailings into the Kafue river.
In plain language: The barrel argument gets the essential point right: a house is not judged by the price of its cheapest light bulb, but by the cost of having light in every room, at any hour, all year round. And it is right to recall that nothing is free: even the cleanest panel begins in a hole in a mountain.
Five errors of method
Those who compare technologies almost always commit one or more of five errors of method. The barrel argument commits all five, without declaring any of them. Each one, on its own, changes the result. Together, they reverse it.
1. The copper is not in the panel. A photovoltaic module has only a few hundred grams of copper, in the ribbons that connect the cells. The rest is around it: according to the photovoltaic programme of the International Energy Agency (IEA-PVPS, 2026), about 75% of the copper in a solar system is in the cables and about 13% in the inverters. The 1.5 kg “per module” is the copper of the system divided by the number of modules. It is legitimate to count it, provided one also counts the copper of the generator, the transformer, the line and the reserve of a nuclear power station. The barrel argument does not.
2. A year of building is not a year of energy. The 400 million tonnes of tailings correspond to the copper of the solar capacity installed in one year. That capacity will produce electricity for 25 to 30 years. If the flow of one year is divided by the solar output of that same year, the result is 145 to 190 tonnes of tailings per GWh. If it is spread over the working life of the installations, the correct value is obtained:

where mCu is the system copper per MW (3.3 t, the value implicit in Rüegg), r is the ratio of tailings to copper (200/1.5 ≈ 133), FC is the capacity factor (0.13) and T is the working life (30 years). The result is about 13 tonnes per GWh: ten to fifteen times less than the annual reading. The original argument does not state its method, but the difference shows how much the result depends on it.
3. Uranium also comes from mines. The world nuclear fleet consumes about 26 tonnes of natural uranium per TWh. At an ore grade of 0.1%, common in many mines, that corresponds to about 26 tonnes of ore per GWh: the same order of magnitude as solar. In the high-grade Canadian mines the value falls to less than one tonne, and in situ leaching, used in Kazakhstan, leaves no tailings on the surface, but injects acid into the aquifers. Uranium tailings contain heavy metals and also radium-226, with a half-life of about 1,600 years, and thorium-230, with 75,000 years. They do not “disappear” either. In December 2025, Niger accused Orano of radioactive pollution near Arlit; the company denies it.
4. Copper comes back; fuel does not. Copper is recycled with no loss of quality. According to the International Copper Association, about 32% of world supply already comes from recycled material. The tailings of the first extraction are shared over several life cycles. Nijnens and colleagues (2023) showed that a decarbonised energy system will probably require less mining than the current fossil system, in which coal accounts for 97% of the ore extracted for energy.
5. The right neighbour is coal. Solar does not replace nuclear: it mainly replaces coal and gas. The coal combustion residues in the United States alone — ash and gypsum — were about 58 million tonnes in 2024, for 652 TWh produced: about 88 tonnes per GWh, without counting the earth removed in the mines. Coal also releases mercury, arsenic and cadmium directly into the atmosphere. According to the data compiled by Ritchie (Our World in Data), coal causes about 24.6 deaths per TWh, nuclear about 0.03 and solar about 0.02.
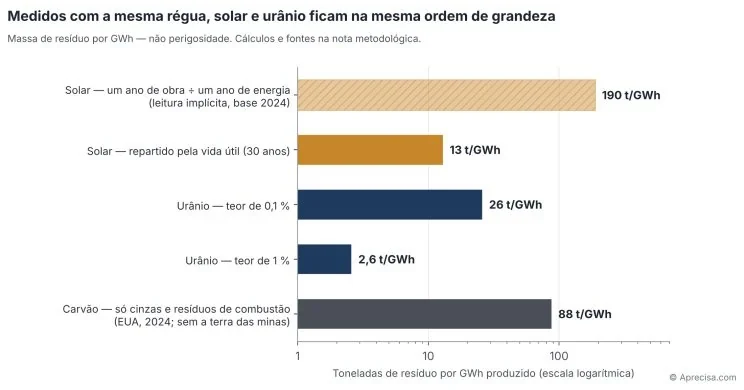
Figure 1 measures all sources with the same ruler: tonnes of waste per GWh produced. The longest solar bar is the reading that divides one year of building by one year of energy; the short bar is the same reality spread over the working life. Uranium at a common grade sits next to solar, and coal, with its combustion residues alone, sits above both. The scale is logarithmic: instead of each division adding a fixed amount, each vertical line is worth ten times the previous one — 1, 10, 100. It is like marking on a map the bakery 100 metres from home, the town 1 kilometre away and the city 10 kilometres away. On an ordinary ruler, the bakery would be squashed next to zero; on a logarithmic ruler, each jump of ten times takes up the same space and all three fit side by side. In the figure, the same distance therefore always corresponds to the same multiplication: from solar (13) to uranium (26) is double, from uranium to coal (88) is more than triple, and from the bar of 190 to the bar of 13 is about fifteen times. The logarithmic scale is explained in detail in «Dez decibéis não são mais dez» (“Ten decibels are not ten more”); the other rulers of energy, in «A energia não cabe numa régua só» (“Energy does not fit on a single ruler”). The figure compares mass, not hazard, because hazard depends on how each kind of waste is contained.
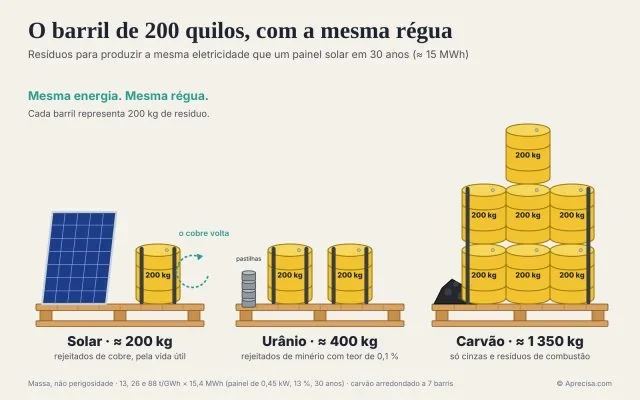
Figure 2 translates Figure 1 into barrels. A solar panel of 0.45 kW produces about 15 MWh in 30 years; at 13 tonnes of tailings per GWh, that gives about 200 kilos — Rüegg’s barrel is right about the mass. But to produce the same electricity, uranium mining at a 0.1% grade leaves about 400 kilos, two barrels, and coal leaves about 1,350 kilos in ash and combustion residues alone, seven barrels, without counting the earth from the mines. The barrel exists; it is the smallest of the three. As in Figure 1, mass is compared, not hazard.
Hazard is not risk. The “50,000 potential lethal doses per GWh” measure the intrinsic hazard of a material, not the risk it poses. Risk depends on the exposure pathways: mobility in water, inhalation, containment. The argument itself recognises this when it describes the glass, the steel and the granite of the nuclear repository. But the same logic holds for tailings: the international standard for tailings management (GISTM, 2020), promoted by the ICMM, UNEP and the Principles for Responsible Investment, has 77 auditable requirements aimed at bringing the risk to zero. I have not found the value of 50,000 lethal doses per GWh in any peer-reviewed publication.
In plain language: Weighing two suitcases, one full and one empty, does not tell you which is heavier. Dividing the price of a house by one year’s rent does not tell you how much it costs to live in it. And a returnable bottle goes back to the shop, while a disposable bottle goes in the bin. These three errors — the suitcase, the house and the bottle — are enough to turn a serious number into a propaganda number.
What also counts
The sun sets every day, but the battery also charges every day. It is true that long-duration storage remains unsolved, and that not even in the Sahara can one escape the sunset. But daily storage is no longer a promise. According to BloombergNEF, the average price of batteries for stationary storage fell to about 70 $/kWh in 2025, 45% less in one year. China installed about 190 GWh of grid batteries in 2025 alone. In Abu Dhabi, Masdar has begun building 5.2 GW of solar with 19 GWh of batteries, to deliver 1 GW continuously, 24 hours a day, from 2027. The problem of the two hours in the late afternoon, which I described in connection with the Iberian system, is precisely what this storage solves. The problem of weeks without wind and without sun is not.
Industrialising nuclear is not a matter of will. The diagnosis that nuclear is held back by industrialisation is right, but the remedy is slower than is usually suggested. The Flamanville 3 power station cost about 23.7 billion euros, against 3.3 billion forecast, according to the French Court of Audit. Vogtle 3 and 4, in the United States, cost about 35 billion dollars. Hinkley Point C has already reached 31 to 35 billion pounds, with the first unit postponed to 2030. Grubler (2010) argued that even the French programme, industrialised and built in series, had negative learning; Escobar Rangel and Lévêque dispute the magnitude. South Korea shows that it is possible to do better, but it also shows the condition: a fleet, not a prototype; continuous teams, not teams rebuilt every twenty years.
Small modular reactors are still an expensive promise. The NuScale project for Utah was cancelled in 2023, when the target price went from 55 to 89 $/MWh. At Darlington, in Ontario, the four BWRX-300 units are budgeted at 20.9 billion Canadian dollars, 7.7 billion for the first alone, with entry into service around 2030. China’s 125 MW Linglong One began hot testing in October 2026, behind schedule. Demand exists — Microsoft, Google, Amazon and Meta have signed contracts for several gigawatts — but almost all of the delivery comes after 2030.
A repository is possible, but it is not easy. Finland’s ONKALO exists, cost about one billion euros to build and in August 2026 received a favourable safety assessment from the regulator STUK, but the operating licence has been postponed three times and, at the time of writing, had still not been granted. The German repository at Schacht Konrad, intended only for low- and intermediate-level waste, did not cost 20 million: its estimated total cost is about 6.7 billion euros, and the start of disposal has moved from 2013 to the early 2030s. The cost per kWh of final disposal is small; the time it takes and social acceptance are not.
A large power station is also a large failure. A 1.6 GW nuclear unit, when it trips, defines the reference incident that the whole system must withstand with reserve. That reserve cost is a system cost and must go into the same calculation that is demanded of solar. And the ENTSO-E final report on the Iberian blackout of 28 April 2025 showed that stability cannot be bought with a technology: voltage control failed, in renewables operating at a fixed power factor and also in synchronous units that did not meet their reactive power setpoint.
Adapting is not the same as adapting quickly. It is often pointed out that Singapore and Okinawa live well with average temperatures 10 to 15 °C above those of Central Europe. That is true, but it confuses two stable climates with a rapidly changing climate, and it forgets that Singapore’s comfort rests on air conditioning, that is, on more electricity. Adaptation is indispensable, but it does not replace mitigation; it adds demand to it.
Table 2 brings together the scientific and institutional literature used in this essay, grouped by theme, with the direction in which each work weighs on the claims of Table 1. More than twenty international authors and institutions confirm the system conclusions and contradict, or qualify, the materials calculations.
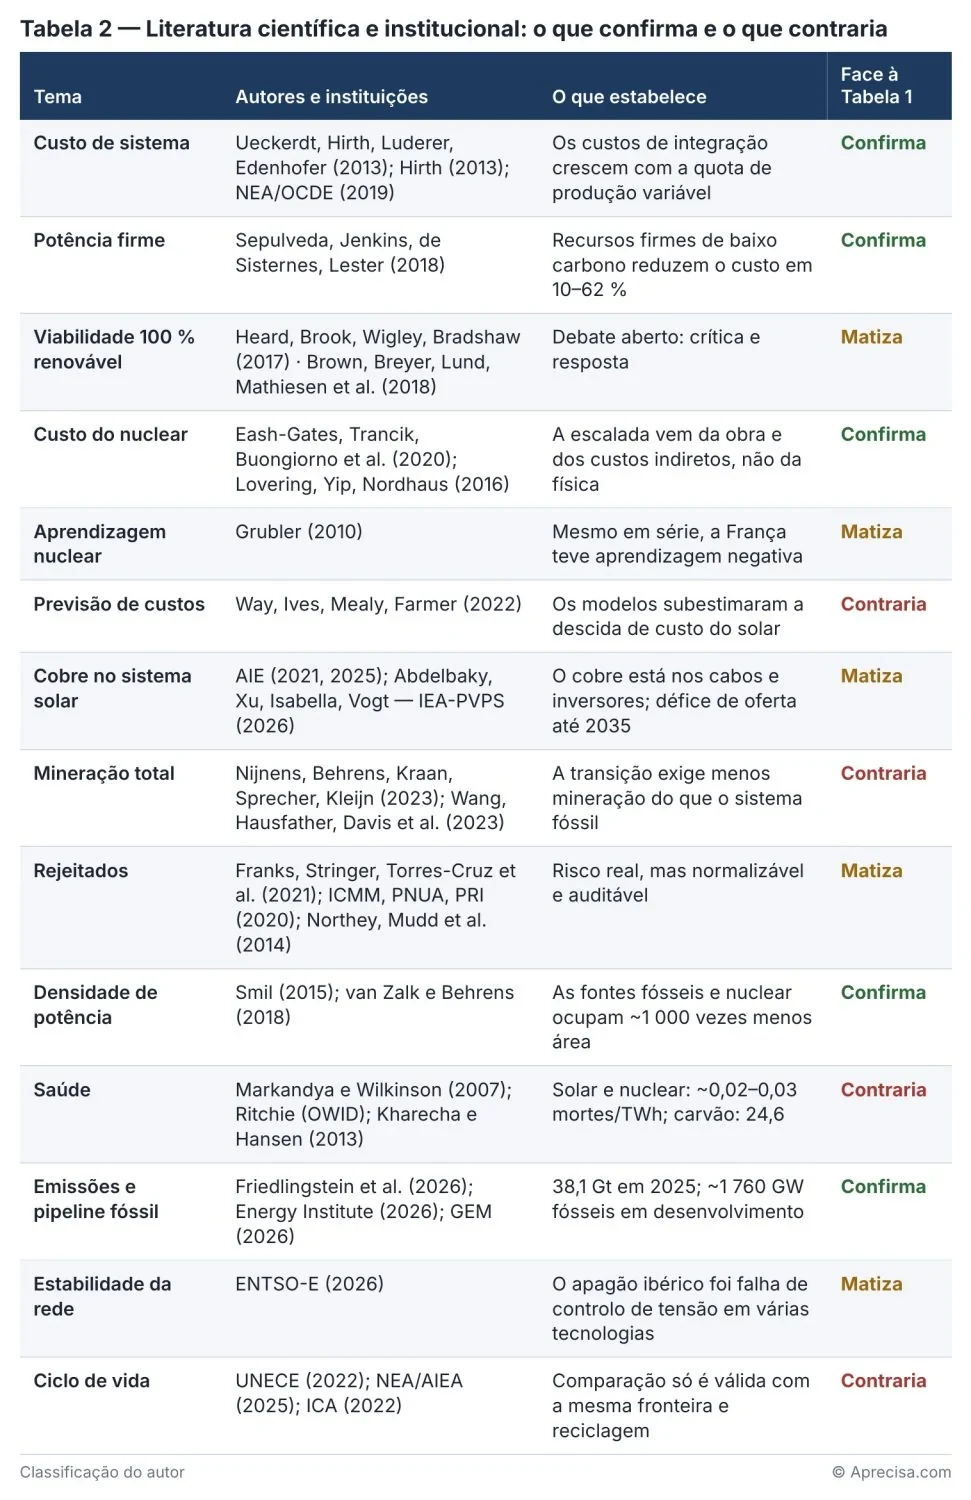
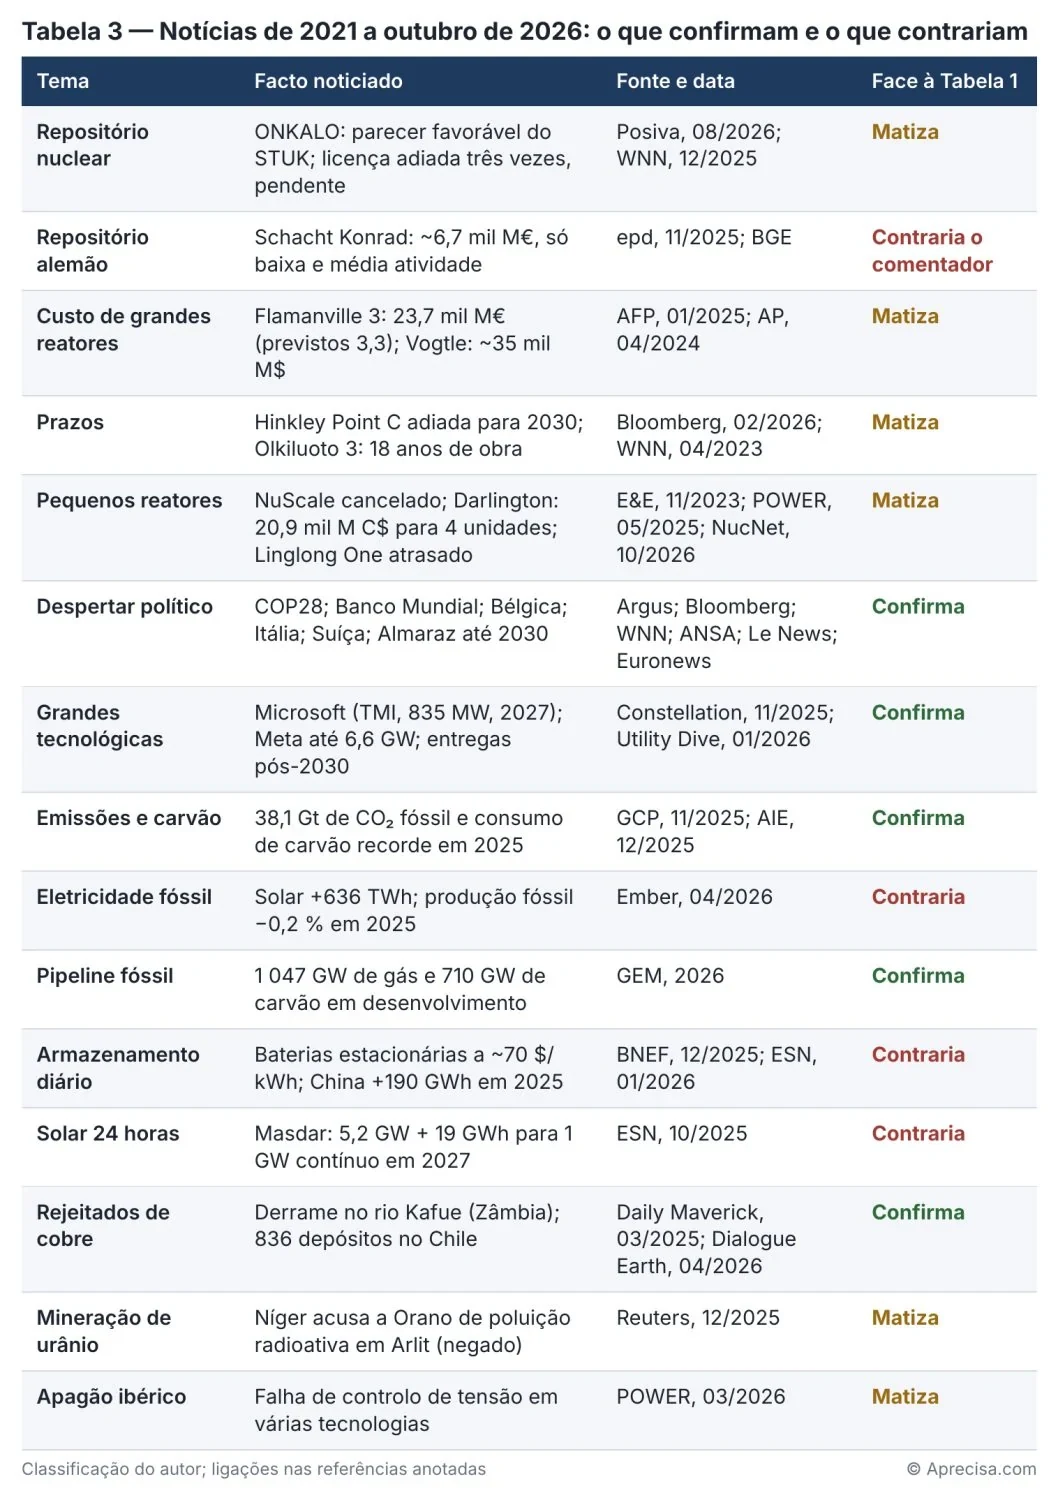
Table 3 does the same exercise with the news from 2023 to October 2026. The pattern repeats itself: the facts of the real world confirm the political awakening of nuclear and fossil persistence, but they refute the idea that daily storage does not exist and the idea that the cost of nuclear is only a question of regulation.
Two propagandas and one ruler
The discussion about energy has been captured by two symmetrical propagandas. One uses nuclear waste, accidents and delays to declare nuclear finished. The other now uses mining waste to declare solar dirty. Both commit the same error of method: they change ruler when they change technology.
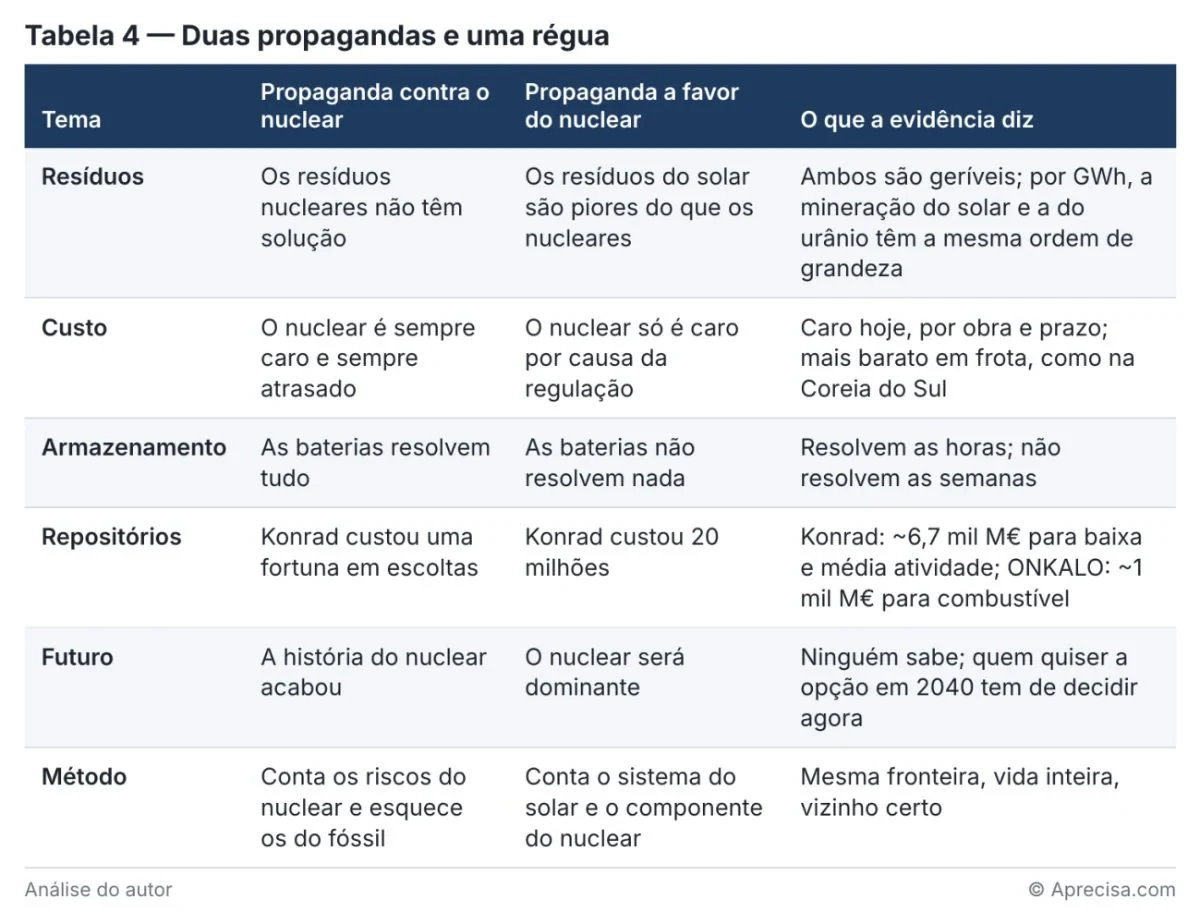
Table 4 lines up the claims of the two propagandas against what the evidence says. Neither of the left-hand columns stands up on its own. The right-hand column is not a diplomatic middle ground: it is the result of applying the same ruler to both sides.
In plain language: In a football match, a referee who only gives fouls against one team is not refereeing, he is playing. In energy, anyone who counts the waste of only one technology is doing the same. A good referee does not have to like both teams; he has to use the same rules for both.
The inevitabilities: where good decisions come from
My position is pragmatic. I agree with the evidence, wherever it comes from, but I do not stop there. A piece of evidence tells us what is true; a decision needs to know what is inevitable. Preferences — liking or disliking nuclear, liking or disliking solar — change with elections. Inevitabilities do not change, and it is they that should ground deliberations.
An electricity grid obeys three clocks at the same time, and each one imposes its own inevitability.
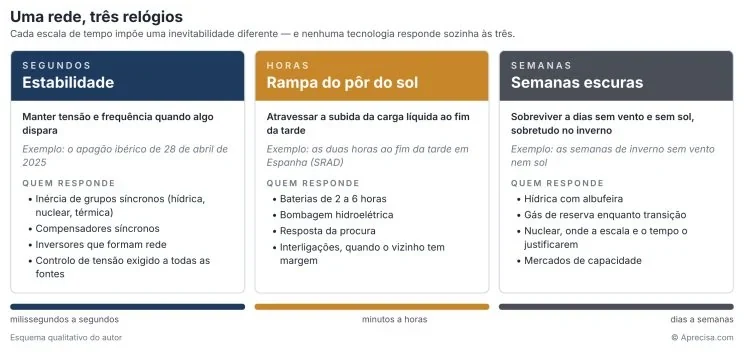
Figure 3 shows that the same grid has to solve three different problems, on three timescales. In seconds, it has to maintain voltage and frequency: that is the problem of the blackout of April 2025. In hours, it has to get through the sunset ramp: that is the problem of the two hours in the late afternoon. In weeks, it has to survive periods without wind and without sun: that is the problem most often invoked by the advocates of nuclear. Each clock calls for its own resources, and no technology answers all three on its own.
From this follow seven inevitabilities. None of them depends on being for or against a technology.
- The sun sets every day. The late-afternoon ramp is certain; therefore daily storage of two to six hours and demand response are mandatory, and they are already competitive.
- There are weeks without wind and without sun. Therefore firm power is indispensable: reservoir hydro, pumped storage, reserve gas as a transition and, where scale and time justify it, nuclear.
- The grid has to control voltage and frequency in seconds. Therefore system services must be required of all sources, including grid-forming inverters and synchronous condensers.
- All energy begins in a mine. Therefore the comparison must use the same boundary for all technologies, the tailings management standard must be required throughout the supply chain and recycling must be planned from the design stage.
- Fossil fuels will last for decades. Therefore the exit must be managed and not denied: coal first, then gas as a reserve, with the alternative firm power built before the fossil power stations are closed.
- Nuclear takes ten to twenty years. Therefore whoever wants it in 2040 has to decide now, following the milestones of the International Atomic Energy Agency, and decide on a fleet, not a prototype.
- The climate has already changed. Therefore adaptation is mandatory, but it adds electricity demand, and it does not replace mitigation.
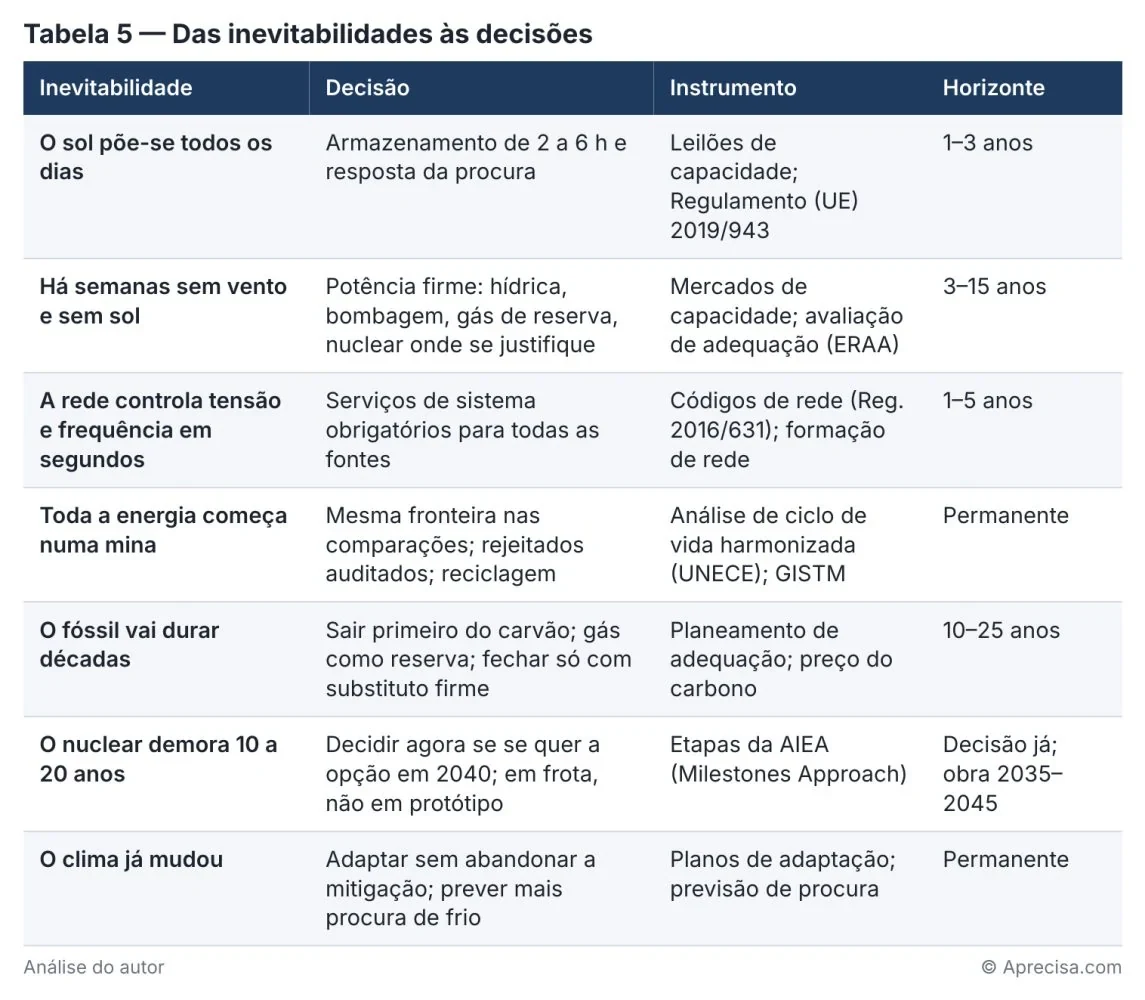
Table 5 turns each inevitability into a decision, an instrument and a horizon. This is where the debate stops being a dispute between preferences and becomes a grounded deliberation. In public administration, a deliberation is only as good as the ruler that grounds it.
In plain language: Someone planning a long journey does not argue about whether they prefer day or night. They know it will get dark and they take headlights; they know there may be a week of rain and they take tyres in good condition; they know the tank will run out and they plan where to refuel. Preferences choose the car. Inevitabilities choose the equipment. Energy is the same.
What it means for Portugal
Portugal has no nuclear power stations, but it is connected to a system that does. Spain has extended the operation of the two units at Almaraz until June 2030, a few dozen kilometres from the border. In the late afternoon, as I showed in «Duas horas ao fim da tarde», the Iberian margin is already managed with the last step: ordering factories to stop.
The inevitabilities give Portugal a clear agenda:
- First, the clock of hours: batteries and pumped storage sized for the sunset ramp, with their own auctions and without waiting for the neighbour.
- Second, the clock of seconds: require voltage control and grid-forming services from all new generators, as ENTSO-E recommended after the blackout.
- Third, the clock of weeks: assess all the firm power options with the same ruler, including, without taboo and without faith, the nuclear option for the 2040s, starting with the first phase of the milestones of the International Atomic Energy Agency, which is to study without committing.
Deciding to study is not deciding to build. But not studying is deciding, by omission, that the option will not exist when it is needed.
Conclusion
Those who compare technologies are right when they think like systems engineers and stop being right when they think like advocates of a technology. The 200-kilo barrel is the perfect example: a good image and a bad calculation, which attributes the copper of the system to the panel, divides a year of building by a year of energy, forgets that uranium also comes from mines, that copper comes back and that solar’s real neighbour is coal.
Nuclear does not need this argument. It deserves to be assessed on its merits — a lot of energy, little area, little CO₂, a lot of inertia — and on its problems: cost, lead time and units so large that they require their own reserve. Solar does not need defenders who deny mining either; it needs batteries for the late afternoon and firm power for the dark weeks.
Three rules are enough to separate evidence from propaganda: count the same things on both sides, count the whole life and compare with what is really being replaced. Seven inevitabilities are enough to separate preference from decision. The rest is noise.
In plain language: Nobody chooses between a car’s headlights and its brakes. You need both, each for its own situation. Solar is the cheap engine of the day, batteries are the headlights of the late afternoon and firm power is the brakes for the difficult weeks. Arguing about which of them is “the best” is a waste of time; the right question is how much of each, and by when.
Gaspar do Amaral
Methodological note
Everything in this essay that is not published data, but a calculation, classification or construction by the author, is identified below.
1. Solar tailings per GWh, over the working life. R = (mCu × r) ÷ (FC × 8,760 h × T). With mCu = 3.3 t/MW (1.5 kg per module of about 0.45 kW, the value implicit in Rüegg), r = 200/1.5 ≈ 133 t of tailings per tonne of copper (Rüegg’s value, consistent with ore grades of 0.6 to 0.8%), FC = 0.13 and T = 30 years: R = 3.3 × 133 ÷ (0.13 × 8,760 × 30 ÷ 1,000) ≈ 13 t/GWh.
2. Solar tailings per GWh, by the annual reading. 400 Mt (Rüegg’s value, not verified) ÷ world solar output of 2,131 TWh (2024) to about 2,770 TWh (2025, according to Ember) ≈ 145 to 190 t/GWh. Figure 1 uses 190 t/GWh, the 2024 base.
3. Uranium ore per GWh. World requirement of 67,517 t of uranium in 2024 ÷ 2,602 TWh produced in 2023 (World Nuclear Association data) ≈ 26 t U/TWh. At a grade of 0.1%: 26,000 t of ore per TWh, or 26 t/GWh; at 1%: 2.6 t/GWh. The base years differ by one, which does not change the order of magnitude. It was not possible to verify a world average grade; in situ leaching produces no tailings on the surface.
4. Coal combustion residues per GWh. 63.6 million short tons (≈ 57.7 Mt) of coal combustion products in the USA in 2024 (American Coal Ash Association) ÷ 652.2 TWh of coal-fired generation (EIA) ≈ 88 t/GWh. Excludes the earth and rock removed in mining.
5. Other derived quantities. Fossil power stations in development: 710 GW of coal + 1,047 GW of gas ≈ 1,760 GW (Global Energy Monitor). Schacht Konrad: €6.7 billion ÷ €20 million ≈ 335, that is, “more than three hundred times”. Difference between the two readings of solar: 145 ÷ 13 ≈ 11 and 190 ÷ 13 ≈ 15, that is, “ten to fifteen times”. Copper per TWh: about 68 t for solar against 2.5 t for nuclear, 3.0 t for coal and 5.4 t for gas, according to the compilation cited by the World Nuclear Association (a source without peer review); 68 ÷ 5.4 ≈ 13 and 68 ÷ 2.5 ≈ 27, that is, 13 to 27 times, and not 50.
6. Figure 1. Built by the author with the values of points 1 to 4. It compares mass and not hazard. The kinds of waste are not of the same type: copper tailings, uranium tailings and coal ash have different compositions, mobilities and management regimes.
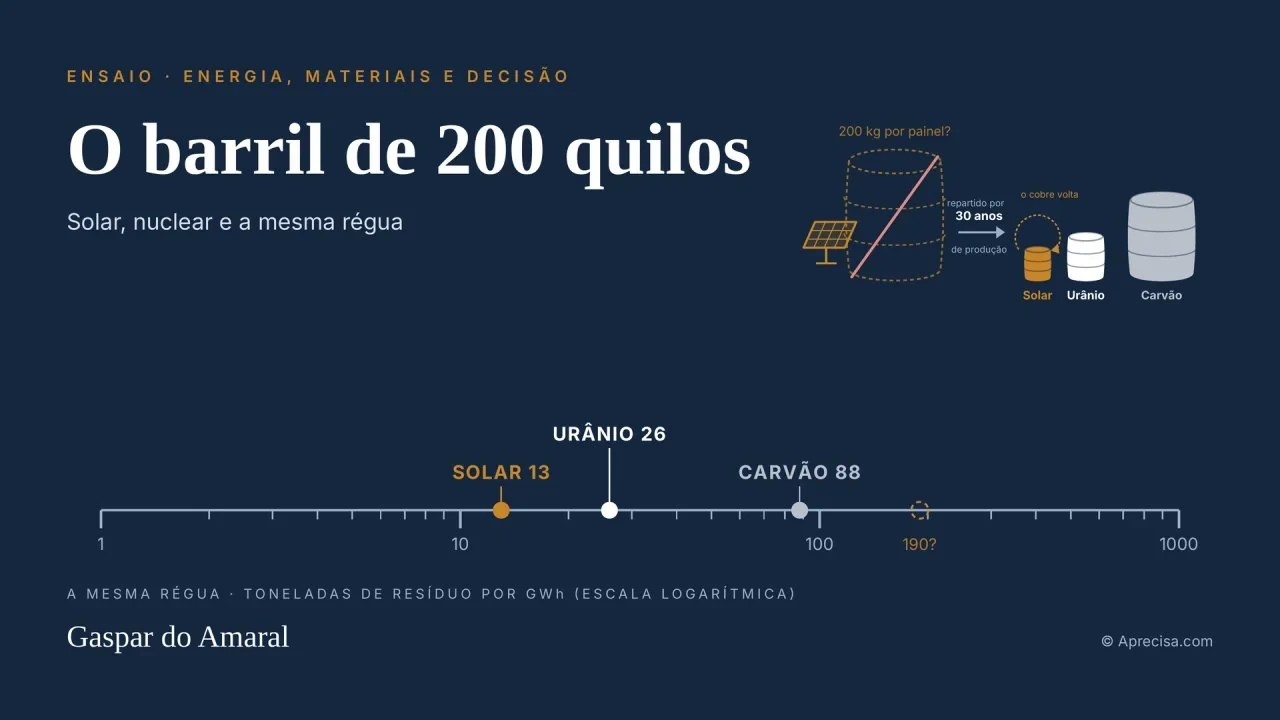
7. Cover. Drawing built by the author. The dashed and crossed-out barrel represents the reading of one year of building divided by one year of energy (about 190 t/GWh). The three full barrels have an area proportional to the values calculated in points 1, 3 and 4: solar spread over the working life (13 t/GWh), uranium at a 0.1% grade (26 t/GWh) and coal, with its combustion residues alone (88 t/GWh). The arrow indicates the spreading over the 30 years of production; the circular arrow indicates that copper is recyclable. The ruler on the cover uses the same values, on a logarithmic scale, explained in the paragraph on Figure 1.
8. Figure 2. Illustration by the author. Energy of a panel in 30 years: 0.45 kW × 0.13 × 8,760 h × 30 ≈ 15.4 MWh. Waste: 13 × 0.0154 ≈ 0.20 t (solar); 26 × 0.0154 ≈ 0.40 t (uranium, 0.1%); 88 × 0.0154 ≈ 1.35 t (coal, rounded to 7 barrels of 200 kg).
9. Figure 3. Qualitative diagram built by the author. The timescales are indicative.
10. Tables 1 to 3. The classification “confirms”, “qualifies” or “contradicts” is the author’s, based on the numbers published in each source. “Qualifies” means that the source confirms part of the claim and contradicts another part, or that the result depends on the method.
11. Cut-off date. The news was checked up to 10 October 2026. Ongoing situations, such as the ONKALO licence or the Swiss referendum, may have developed after this date.
About this translation. A translation of the essay the author published on LinkedIn on 10 October 2026; the full Portuguese version is on this site. The cover, the five tables, the formula and the three figures of the original are images with texts in Portuguese: they are reproduced as they are, with translated captions that give their titles and headings. The boxes “In plain language” and the paragraphs that explain the figures are the author’s. The annotated references keep the order of the original in one numbered list: 1 to 5, starting point; 6 to 37, scientific literature and institutional reports; 38 to 73, news (2021–2026). The titles of the sources stay in the original; the headlines of the news, which the original gives in Portuguese, and the annotations are translated. The author’s other articles cited («Duas horas ao fim da tarde», «Dez decibéis não são mais dez», «A energia não cabe numa régua só») are in Portuguese.
References
- Rüegg, W. (08/10/2026), The Power of Energy Density, LinkedIn — origin of the barrel argument, used as an exemplary case. Original version, in German and with more assertive claims: Rüegg, W. (08/10/2026), Die schmutzige Seite des sauberen Stroms – und die Macht der Energiedichte, Sichtweisen Schweiz.
- Rüegg, W. (2024), Zeitalter der Ängste: Aber fürchten wir uns vor dem Richtigen?, Edition Königstuhl, 2nd ed. — book in which the author grounds the potential lethal doses per GWh.
- Amaral, G. (10/2026), Duas horas ao fim da tarde (Two hours in the late afternoon), LinkedIn — the eleven stop orders to Spanish industry in 2026 and the adequacy of the Iberian system (in Portuguese).
- Amaral, G. (10/2026), Dez decibéis não são mais dez — sobre a escala logarítmica (Ten decibels are not ten more — on the logarithmic scale), LinkedIn — the ruler that multiplies, explained with everyday life (in Portuguese).
- Amaral, G. (10/2026), A energia não cabe numa régua só — ordens de grandeza, escalas e logaritmos (Energy does not fit on a single ruler — orders of magnitude, scales and logarithms), LinkedIn — power and energy, prefixes, percentages and the logarithmic ruler in energy (in Portuguese).
- Ueckerdt, F., Hirth, L., Luderer, G. and Edenhofer, O. (2013), System LCOE: What are the costs of variable renewables?, Energy 63 — with 40% wind power, integration costs equal the levelised cost.
- Hirth, L. (2013), The market value of variable renewables, Energy Economics 38 — the market value of variable generation falls as its share grows.
- NEA/OECD (2019), The Costs of Decarbonisation: System Costs with High Shares of Nuclear and Renewables — system costs from less than 10 $/MWh (10%) to more than 50 $/MWh (75%).
- Sepulveda, N., Jenkins, J., de Sisternes, F. and Lester, R. (2018), The role of firm low-carbon electricity resources in deep decarbonization, Joule 2(11) — firm resources reduce the cost by 10 to 62%.
- Heard, B., Brook, B., Wigley, T. and Bradshaw, C. (2017), Burden of proof, Renewable and Sustainable Energy Reviews 76 — a critique of the feasibility of 100% renewable systems.
- Brown, T., Bischof-Niemz, T., Blok, K., Breyer, C., Lund, H. and Mathiesen, B. (2018), Response to «Burden of proof», Renewable and Sustainable Energy Reviews — reply: the criteria can be met at low cost.
- Eash-Gates, P., Klemun, M., Kavlak, G., McNerney, J., Buongiorno, J. and Trancik, J. (2020), Sources of cost overrun in nuclear power plant construction, Joule 4(11) — indirect costs and low productivity explain the escalation.
- Lovering, J., Yip, A. and Nordhaus, T. (2016), Historical construction costs of global nuclear power reactors, Energy Policy 91 — 349 reactors; no inevitable escalation.
- Grubler, A. (2010), The costs of the French nuclear scale-up: A case of negative learning by doing, Energy Policy 38(9) — cost escalation even in series construction.
- Way, R., Ives, M., Mealy, P. and Farmer, J. D. (2022), Empirically grounded technology forecasts and the energy transition, Joule 6 — the models systematically underestimated the fall in the cost of solar.
- IEA (2021), The Role of Critical Minerals in Clean Energy Transitions — mineral intensity by technology.
- IEA (2025), Global Critical Minerals Outlook 2025 — a shortfall of about 30% in copper supply by 2035.
- Abdelbaky, M., Xu, Y., Isabella, O. and Vogt, M. (2026), Material Flows for the Future Global Deployment of Silicon-based PV Systems, IEA-PVPS T12-34 — about 75% of the copper in the cables and 13% in the inverters.
- UNECE (2022), Carbon Neutrality in the UNECE Region: Integrated Life-cycle Assessment of Electricity Sources — harmonised life-cycle assessment of all sources.
- World Nuclear Association, Mineral Requirements for Electricity Generation — reproduces the IEA’s mineral intensity and a comparison of copper per TWh (solar 68 t; nuclear 2.5 t; coal 3.0 t; gas 5.4 t).
- Nijnens, J., Behrens, P., Kraan, O., Sprecher, B. and Kleijn, R. (2023), Energy transition will require substantially less mining than the current fossil system, Joule 7(11) — coal is 97% of the ore extracted for energy.
- Wang, S., Hausfather, Z., Davis, S. et al. (2023), Future demand for electricity generation materials under different climate mitigation scenarios, Joule — sufficient geological reserves in 75 scenarios.
- Franks, D., Stringer, M., Torres-Cruz, L. et al. (2021), Tailings facility disclosures reveal stability risks, Scientific Reports 11 — about 10% of the declared dams with stability problems.
- ICMM, UNEP and PRI (2020), Global Industry Standard on Tailings Management — 77 auditable requirements.
- Northey, S., Mohr, S., Mudd, G., Weng, Z. and Giurco, D. (2014), Modelling future copper ore grade decline, Resources, Conservation & Recycling 83 — the decline in copper ore grades.
- Smil, V. (2015), Power Density: A Key to Understanding Energy Sources and Uses, MIT Press — reference work on power density.
- van Zalk, J. and Behrens, P. (2018), The spatial extent of renewable and non-renewable power generation, Energy Policy 123 — 177 power densities compared.
- Markandya, A. and Wilkinson, P. (2007), Electricity generation and health, The Lancet 370 — mortality by source of electricity.
- Ritchie, H. (2020, updated), What are the safest and cleanest sources of energy?, Our World in Data — coal 24.6, nuclear 0.03, solar 0.02 deaths per TWh.
- Kharecha, P. and Hansen, J. (2013), Prevented mortality and greenhouse gas emissions from historical and projected nuclear power, Environmental Science & Technology 47(9) — about 1.84 million deaths prevented.
- Friedlingstein, P. et al. (2026), Global Carbon Budget 2025, Earth System Science Data 18 — 38.1 Gt of fossil CO₂ in 2025.
- Global Energy Monitor (2026), Boom and Bust Coal 2026 — 710 GW of coal in development.
- ENTSO-E (2026), Final Report on the Grid Incident in Spain and Portugal on 28 April 2025 — failure of voltage control; cascade of overvoltages.
- International Copper Association (2022), Copper Recycling — 32% of supply comes from recycled material.
- U.S. Energy Information Administration, Electric Power Annual, Table 3.1.A — coal-fired generation of 652.2 TWh in 2024.
- NEA/IAEA (2025), Uranium 2024: Resources, Production and Demand (Red Book) — uranium resources, production and demand.
- World Nuclear Association — reactors and uranium requirements (December 2024) — 67,517 t of uranium for 2024; 2,602 TWh in 2023.
- World Nuclear News (05/12/2025) — New delay to the Finnish repository licence — third postponement of the regulator’s deadline.
- Posiva (04/08/2026) — STUK safety assessment — favourable opinion; licence still to be granted.
- AFP / ScienceAlert (02/06/2026) — The first nuclear waste repository is almost ready — about one billion euros; 6,500 t of uranium.
- epd / evangelisch.de (27/11/2025) — Schacht Konrad: ever more expensive, ever later — about 6.7 billion euros.
- BGE — When will Konrad be ready? — low- and intermediate-level waste; start in the 2030s.
- AP (30/04/2024) — Vogtle 4 enters commercial operation — about 35 billion dollars.
- Bloomberg (20/02/2026) — EDF books a 2.5 billion impairment on Hinkley Point C — first unit postponed to 2030.
- AFP / Connaissance des Énergies (14/01/2025) — Court of Audit recalculates the cost of Flamanville 3 — 23.7 billion euros.
- World Nuclear News (17/04/2023) — Olkiluoto 3 enters regular production — 18 years after construction began.
- Sizewell C (22/07/2025) — Final investment decision — 38 billion pounds, with state participation.
- POWER (08/05/2025) — Ontario authorises construction of the first commercial SMR — 20.9 billion Canadian dollars for four units.
- E&E News (09/11/2023) — NuScale cancels its first project — target price from 55 to 89 $/MWh.
- NucNet (07/10/2026) — Hot testing of Linglong One begins — 125 MW, behind schedule.
- Constellation (18/11/2025) — Restart of Three Mile Island 1 for Microsoft — 835 MW in 2027.
- Utility Dive (09/01/2026) — Meta contracts up to 6.6 GW of nuclear — deliveries from 2032.
- Argus (03/12/2023) — COP28: 22 countries pledge to triple nuclear — by 2050.
- Bloomberg (11/06/2025) — World Bank lifts its ban on financing nuclear — in partnership with the IAEA.
- World Nuclear News (16/05/2025) — Belgium repeals its nuclear phase-out; Denmark reconsiders.
- ANSA (23/09/2026) — Italian Senate approves the nuclear law — implementing decrees by the end of 2026.
- Le News (09/10/2026) — Referendum to keep the ban on new power stations in Switzerland — vote possible in February 2027.
- Euronews (14/08/2026) — Spain extends Almaraz until 2030.
- POWER (23/03/2026) — Anatomy of a blackout — summary of the ENTSO-E final report.
- Global Carbon Project (13/11/2025) — Fossil emissions at a record high — 38.1 Gt.
- Industrial Info (12/2025) — IEA: record coal consumption in 2025 — about 8,845 Mt.
- Ember (21/04/2026) — Solar halts the growth of fossil electricity in 2025 — solar +636 TWh; fossil −0.2%.
- Global Energy Monitor (01/2026) — New gas power station projects — 1,047 GW in development.
- pv magazine (28/01/2026) — China installs 315 GW of solar in 2025.
- BloombergNEF (09/12/2025) — Battery prices fall to 108 $/kWh — stationary storage at 70 $/kWh.
- Energy-Storage.News (27/10/2025) — Masdar begins the largest solar-plus-storage project — 5.2 GW and 19 GWh for 1 GW continuous.
- Energy-Storage.News (30/01/2026) — China installs about 190 GWh of storage in 2025.
- RenewEconomy (13/04/2021) — Saudi Arabia: solar at 1.04 cents/kWh.
- Daily Maverick (25/03/2025) — Copper tailings spill into the Kafue river, Zambia — about 50 million litres.
- Dialogue Earth (23/04/2026) — Chile and its 836 tailings deposits.
- MINING.COM (05/01/2026) — Copper at a record high of 13,000 $/t.
- Reuters / MINING.COM (04/12/2025) — Niger accuses Orano of radioactive pollution — the company denies it.
- Concrete Products (29/01/2026) — ACAA survey of coal combustion products — 63.6 million short tons in 2024.
The discussion is on LinkedIn (in Portuguese)
Comments on this text are made on LinkedIn, where the article was shared in Portuguese. You are welcome to write in English. Agree, disagree or add data: every well-founded objection receives a reply.
Gaspar do Amaral · Original in Portuguese of 10 October 2026, published on this site; translation issued on 27 October 2026 · Figures and tables © Aprecisa.com · AI-assisted