 ← Grupo Aprecisa · Connecting those who know with those who need
Resilience · Newsletter “A Porta Estreita” (The Narrow Gate)
Day 241: The panel that answers
Where the Hormuz crisis stands, the eight questions answered by the day’s data, and how the Painel A Porta Estreita works
Gaspar do Amaral · 27 October 2026
Translated from the Portuguese original. This version was issued on 27 October 2026.
On this site, this article has been
Episode 5 of the series “A Porta Estreita” (The Narrow Gate). In the last few episodes I asked questions at the end of each text. I received many likes and few answers. This episode reverses the order: the questions have been asked, and the ones who answer, every day, are the data.
Before you read, choose one of the eight questions in Table 1, the one that interests you most. At the end, you will be able to check the answer on the panel, with today’s numbers.
In Póvoa de Varzim, outside the harbour master’s office, there is a flagpole. Every morning, someone raises a flag: green, calm sea; yellow, take care; red, nobody goes out.
The fisherman does not ask anyone whether the sea is good. He looks at the flagpole. And he knows the flag is not an opinion: it is what the harbour master’s office measured that morning — the wind, the swell, the bar.
For 240 days, this series told the story of the Hormuz crisis the way you tell the story of a storm: what happened, what comes next, what each family can do. The flagpole was missing. A place where anyone, from a child to a minister, could see the flag of the day without having to ask.
That place has existed since yesterday. It is called the Painel A Porta Estreita, it is at porta.aprecisa343.com, and it updates itself twice a day.
A flag is not an opinion. It is a measurement with a date, in full view of everyone.
Today, day 241: where things stand
Today, 27 October, is day 241 since the Strait of Hormuz closed to trade, on 28 February. Table 1 answers the eight questions of the series with the latest published figure from each source. After it, each answer comes with its calculation, done as if by hand, so that you can check it with pencil and paper.
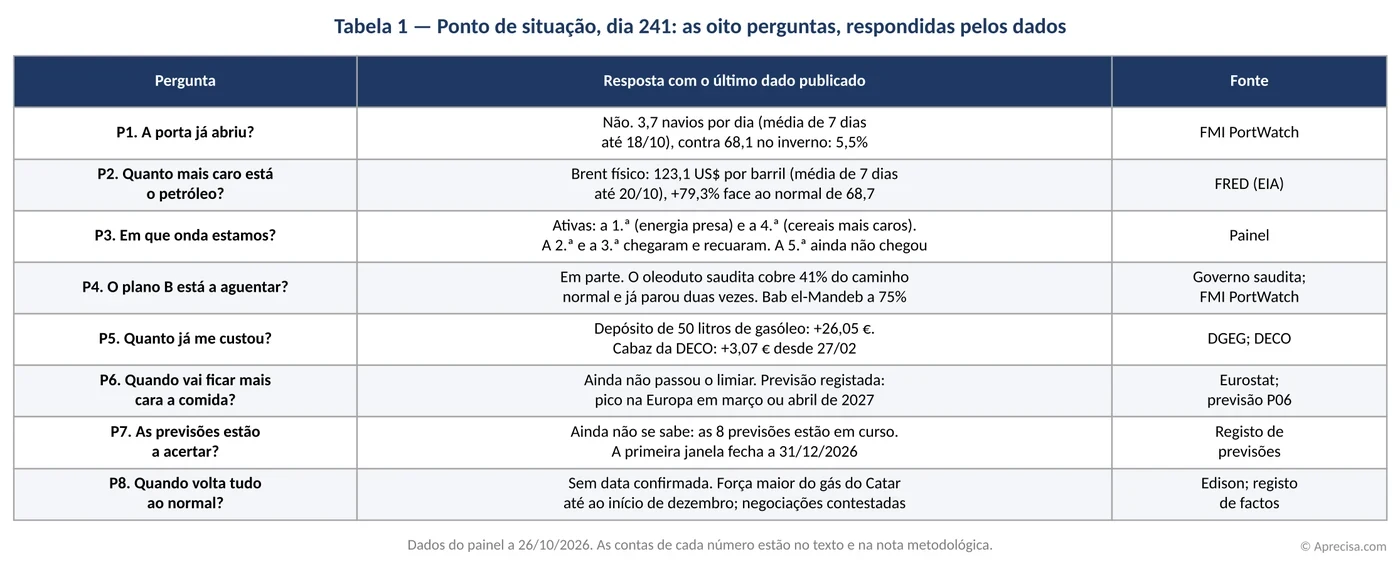
Each row is a question from the series. The middle column gives the answer with the latest published figure, not with an estimate; the right-hand column says who produced the figure. Read the table like the harbour master’s bulletin: it does not say what will happen tomorrow, it says the state of the sea this morning. When the figure changes, the panel changes the answer; the table in this article stays as a snapshot of day 241.
Q1. Has the door opened yet?
No. In the week of 12 to 18 October, an average of 3.7 ships a day passed through Hormuz. In the winter before the crisis, 68 passed. It is like a freeway with 68 cars an hour that suddenly has fewer than 4.
The calculation, by hand
- The 7 daily values published by the IMF, from 12 to 18/10: 3, 7, 3, 2, 7, 0 and 4 ships.
- Sum: 3 + 7 + 3 + 2 + 7 + 0 + 4 = 26. Average: 26 ÷ 7 = 3.71 ships a day.
- The normal: the 58 days from 1/1 to 27/2/2026 add up to 3,947 ships; 3,947 ÷ 58 = 68.1 ships a day.
- How much passes today, as a percentage of normal: 3.71 ÷ 68.1 = 0.0545, that is, 5.5%. 94.5% is missing.
- The threshold of the door is half the normal: 68.1 × 0.5 = 34.0. Since 3.71 is less than 34.0, the door remains “closed” for the panel.
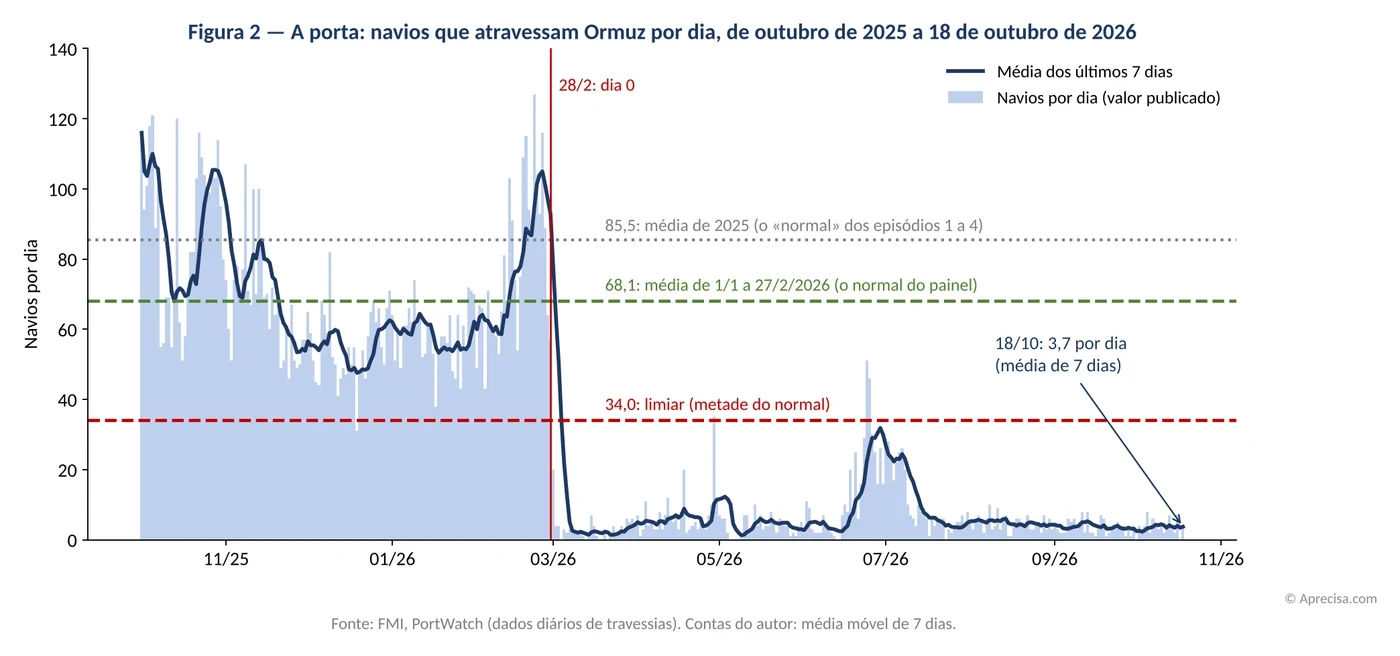
The light bars are the ships of each day; the dark line is the average of the last 7 days, which removes the noise of a single day. The green line is the normal the panel uses (68.1) and the red one is the threshold (34.0, half the normal). The grey dotted line, higher up, is the 2025 average (85.5), which the earlier episodes used. The drawing tells the story without words: a deep valley from 28 February, a small rise in July that never reached the threshold, and since August a line stuck to the floor.
Q2. How much dearer is oil?
A barrel of physical Brent, oil delivered now, cost an average of 123.1 dollars in the week to 20 October. In winter it cost 68.7. Someone who used to pay 10 euros for something made with oil now pays close to 18.
The calculation, by hand
- The last 7 published values (12 to 20/10, working days only): 129.95; 125.78; 126.55; 126.35; 119.33; 118.82; 115.22 dollars.
- Sum: 862.00. Average: 862.00 ÷ 7 = 123.14 dollars.
- The normal: 41 working days from 1/1 to 27/2 add up to 2,816.39; 2,816.39 ÷ 41 = 68.69 dollars.
- Change: (123.14 ÷ 68.69 − 1) × 100 = (1.793 − 1) × 100 = +79.3%.
- The 10 euros of the example: 10 × 123.14 ÷ 68.69 = 17.93 euros.
Q3. Which wave are we in?
The series described five waves, like dominoes: the 1st, energy trapped (the oil and gas that cannot leave the Gulf; for example, dearer diesel at the pump); the 2nd, dearer transport and fertiliser (for example, urea, the most widely used fertiliser in the world); the 3rd, less fertiliser in the fields (farmers buy less because fertiliser has become expensive compared with what they will sell); the 4th, smaller harvests and dearer cereals (for example, the wheat in the flour for bread); and the 5th, dearer food in the supermarket.
Today the 1st and the 4th are active. The 2nd and the 3rd arrived in March and receded in June. The 5th has not yet crossed the threshold, either in the euro area or in Portugal. Figure 3 shows where each one is.
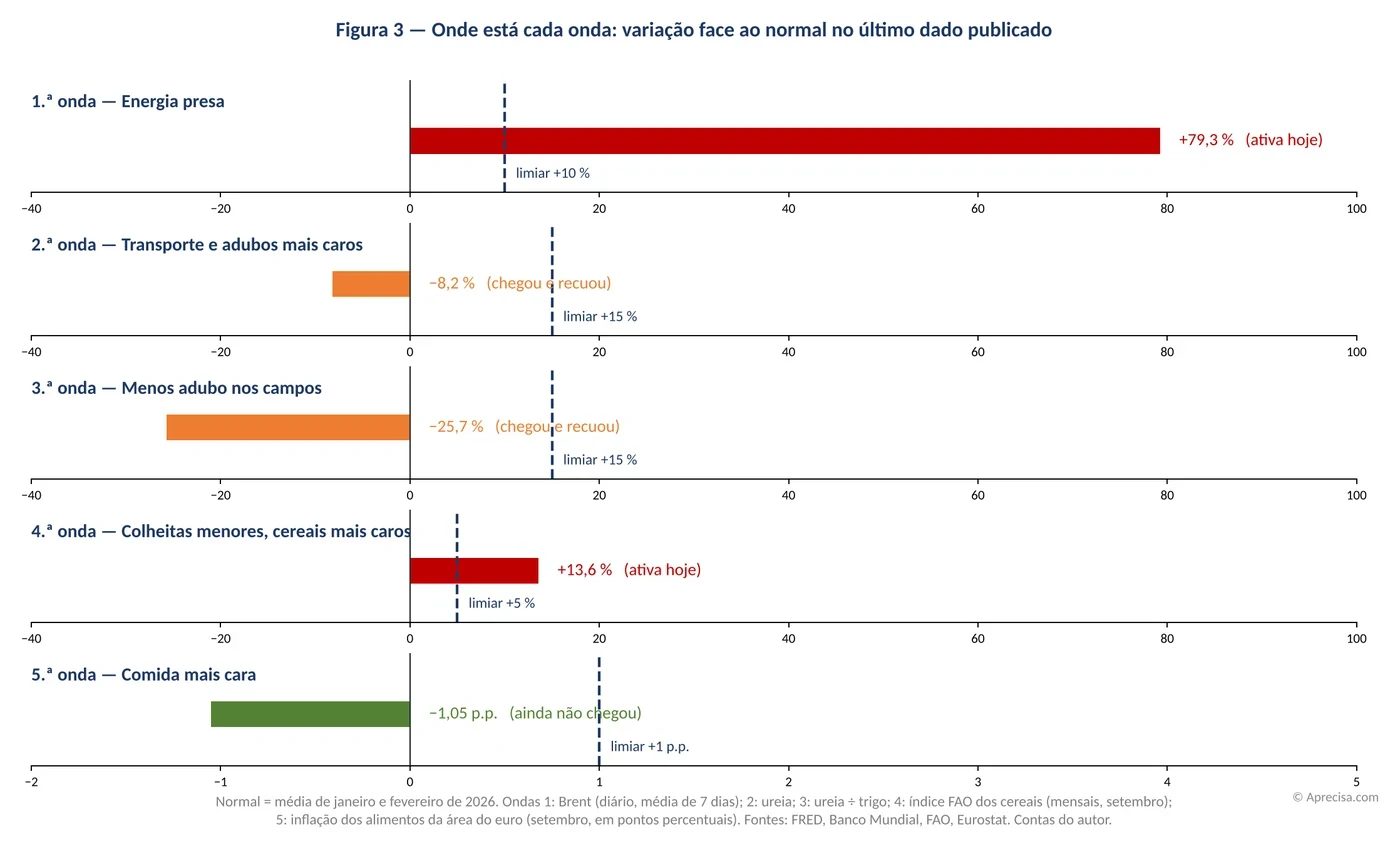
Each strip is a wave. The bar shows how far the latest value is above (to the right) or below (to the left) the normal; the dashed line is the threshold from which the wave counts as having arrived. Red means active today; orange, arrived and has already receded; green, not yet arrived. The 2nd and 3rd waves are below zero: today urea is cheaper than in winter. The 5th is measured in percentage points of inflation, not in percent, and so it has its own scale.
The calculation, by hand
- 4th wave (cereals, FAO index): normal = (107.5 + 108.7) ÷ 2 = 108.1. September: 122.8. Change: (122.8 ÷ 108.1 − 1) × 100 = +13.6%. Threshold: 108.1 × 1.05 = 113.5. Since 122.8 > 113.5, it is active.
- 2nd wave (urea): normal = (415.4 + 472.0) ÷ 2 = 443.7 dollars per tonne. September: 407.5. Change: (407.5 ÷ 443.7 − 1) × 100 = −8.2%. Threshold: 443.7 × 1.15 = 510.3. Below the threshold: it has receded.
- 5th wave (food inflation in the euro area): normal = (2.2 + 2.1) ÷ 2 = 2.15%. Threshold: 2.15 + 1 = 3.15%. September: 1.1%. It has not yet arrived.
- Portugal: normal = (3.3 + 3.7) ÷ 2 = 3.5%; threshold = 4.5%. In April there was 4.6%, but only in that month; the rule requires two months in a row, so as not to mistake a peak for a wave.
Q4. Is plan B holding up?
In part. Saudi Arabia’s plan B, the East–West pipeline, carries up to 7 million barrels a day to the Red Sea, bypassing the strait. Through Hormuz passed 17.1 million. Plan B covers about 41% of plan A, and it stopped in September, after several attacks, according to the Saudi Ministry of Energy, and again on 4 October. At the exit of the Red Sea, Bab el-Mandeb has 75% of its normal traffic.
The calculation, by hand
- Capacity: 7 ÷ 17.1 = 0.409, that is, about 41%.
- Bab el-Mandeb: the normal is 35.2 ships a day; 75% of 35.2 = 0.75 × 35.2 = 26.4 ships a day.
Q5. How much has it cost me already?
Filling a 50-litre tank with diesel today costs €26.05 more than on 1 February. The DECO basket of 63 essential goods costs €3.07 more than on 27 February; in May it cost €7.22 more. A family that fills two tanks a month spends about €52 more a month on fuel alone.
The calculation, by hand
- Diesel (DGEG average price, via the press): €1.659 on 1/2; €2.180 on 2/10. Difference per litre: 2.180 − 1.659 = €0.521. In a tank: 50 × 0.521 = €26.05.
- Two tanks a month: 2 × 26.05 = €52.10.
- DECO basket: €256.26 on 14/10; €253.19 on 27/2. Difference: 256.26 − 253.19 = €3.07. In May: 260.41 − 253.19 = €7.22.
Q6. When will food get dearer?
It has not yet, by the panel’s yardstick. On 14 October the series recorded a forecast, P06: the peak of the 5th wave in the euro area comes in March or April 2027. It is the same yardstick as in 2022, when food rose about six months after energy. The panel will say, with the data, whether it was right.
Q7. Are the forecasts coming true?
It is not yet known, and the panel says exactly that. The eight forecasts of episode 3 were recorded with the date on which they were made and with the test that will assess them. No window has closed yet. The first closes on 31 December: will the DECO basket cost more than €256.26? The forecasts page shows them all, and none can be deleted or rewritten.
Q8. When will everything return to normal?
There is no confirmed date. There are two facts: QatarEnergy extended force majeure on liquefied gas until the beginning of December, confirmed by Edison, which is a party to the contract; and the news about negotiations to reopen the strait contradict each other. On 25 October, an Iranian reopening proposal was reported and denied on the same day by Iranian sources. On the panel, this is recorded as contested, with the two versions side by side.
The panel does not guess. It measures, counts, records, and says “not yet known” when it is not yet known.
What the panel forced us to correct
Building the panel forced us to put all the series on the same yardstick. Four statements from earlier episodes are corrected, or explained, in Table 2. The earlier versions remain published, with their date: correcting is part of the method.
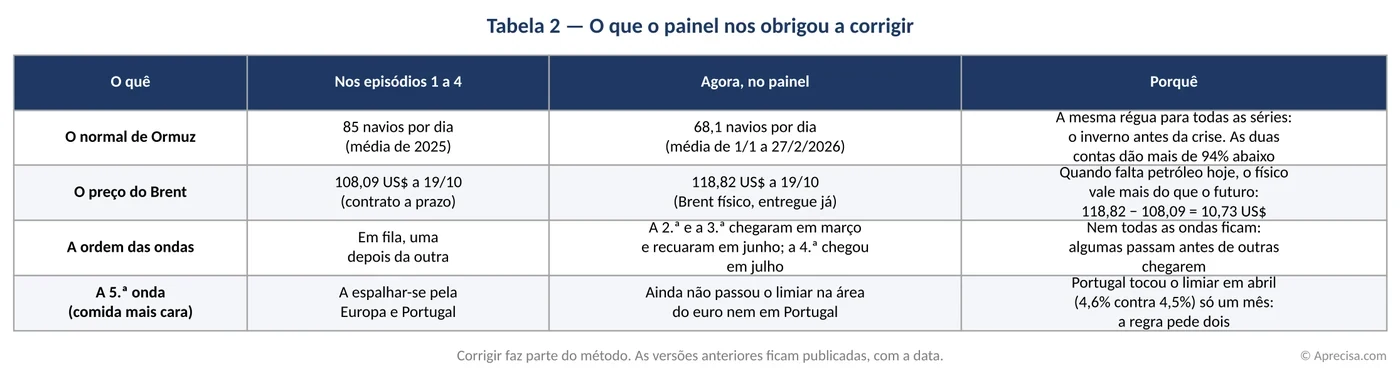
The first column says what was at issue; the second, what episodes 1 to 4 said; the third, what the panel measures today; the fourth, why. No correction changes the conclusion of the series: the door remains almost closed and the waves keep moving. The details change, and the details are what allow each reader to check.
The Brent case deserves a line. There are two prices: that of oil delivered now (physical) and that of the contract for delivery in the future. When oil is short today, today’s oil is worth more. On 19 October, the difference was 118.82 − 108.09 = 10.73 dollars a barrel. The panel uses the physical price, because that is the one that reaches this week’s refineries.
How the panel works
Think of the panel as the harbour master’s office in Póvoa: there are instruments that measure (the open data), someone who records (the register of facts), a rule for raising each flag (the calculations), and a flagpole that everyone sees (the pages). Figure 4 shows the path.
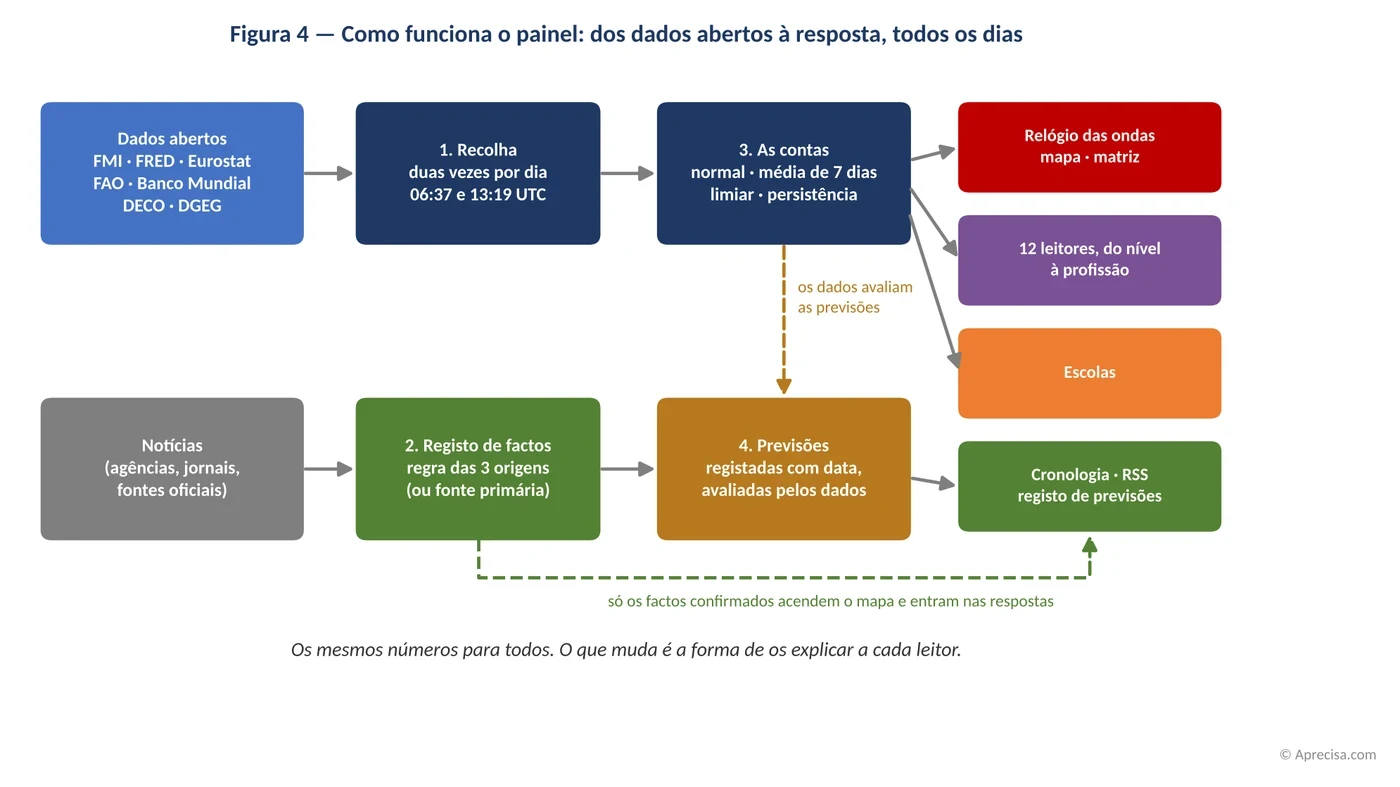
It reads from left to right. At the top, the numbers: twice a day, the panel fetches the open data of the IMF, FRED, Eurostat, the FAO, the World Bank, DECO and the DGEG, does the calculations (the normal, the 7-day average, the threshold and persistence) and lights up the wave clock, the map and the matrix. At the bottom, the words: news items go into the register of facts and only become facts when they meet the three-source rule; only confirmed facts light up the map and go into the answers. The forecasts sit in the middle: recorded with a date, assessed by the data.
The calculations. All the series use the same normal: the average from 1 January to 27 February 2026, the winter before the crisis. A wave only “arrives” when the series crosses the threshold for 7 days in a row (in the daily series) or 2 months in a row (in the monthly ones). It is the same idea as a house alarm that only goes off if the door stays open for more than a few seconds: a gust of wind is not enough.
The facts. A news item comes in as a “report” (in Portuguese, «auto»), the name given to the first record of an event. It moves to “under verification” with two independent sources, and to “confirmed” with three, or with the primary source, whoever produces the data. Five newspapers that copy the same agency count as a single source. Figure 5 shows the ladder with three cases from this week.
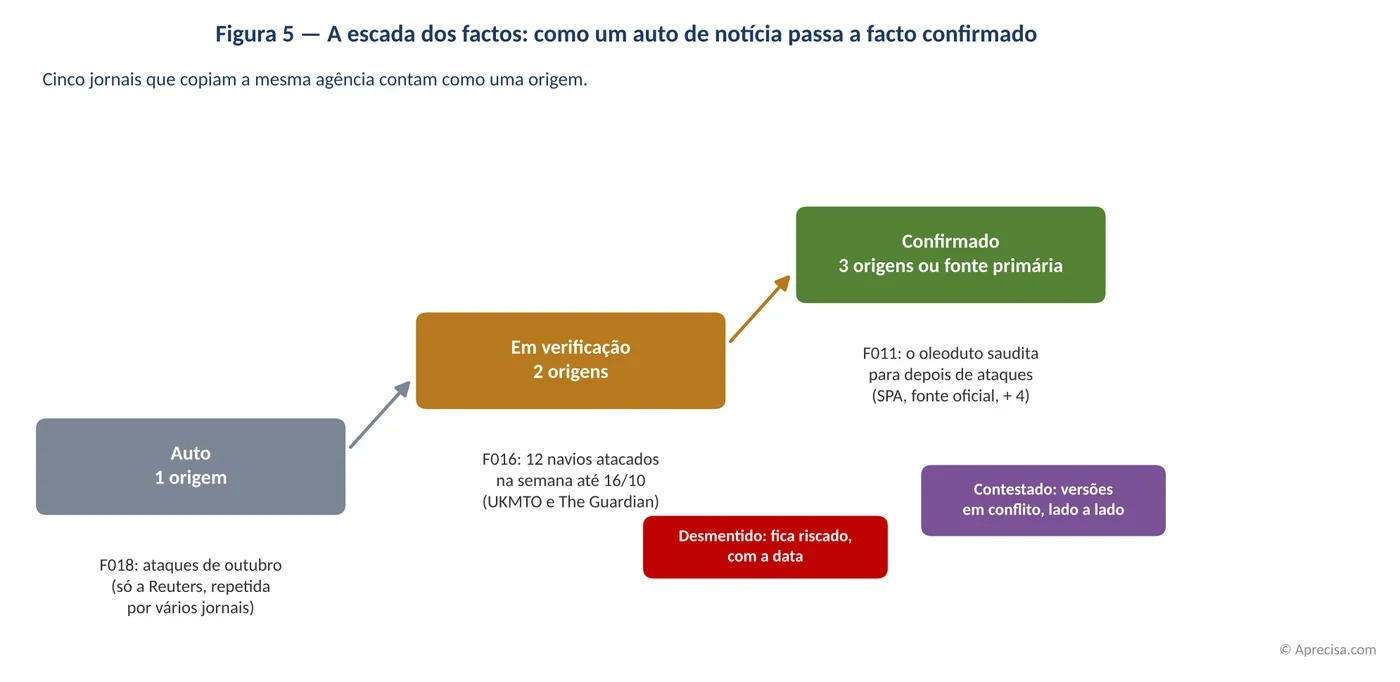
Each step is a status. At the bottom, F018: Reuters reported on 23 October that this is the month with the most attacks on ships since the start of the war, and several newspapers repeated the story; it remains a “report”, because it is a single source. In the middle, F016: twelve ships attacked in the week to 16 October, with two sources. At the top, F011: the stoppage of the Saudi pipeline in September, confirmed by the official Saudi agency, which is the primary source, and by four more sources. To one side are the contested ones, with the conflicting versions side by side, and the denied ones, which are never deleted.
Four new readers. The same number is not explained in the same way to a child and to an engineer. The panel now has twelve readings, in two rows: by level of preparation in this subject (child, family, school, university) and by profession (lawyer, accountant, engineer, military, geopolitics, geostrategy, security, decision-maker). The numbers are the same for all twelve; what changes is the way of saying them. Figure 6 shows the family reading.
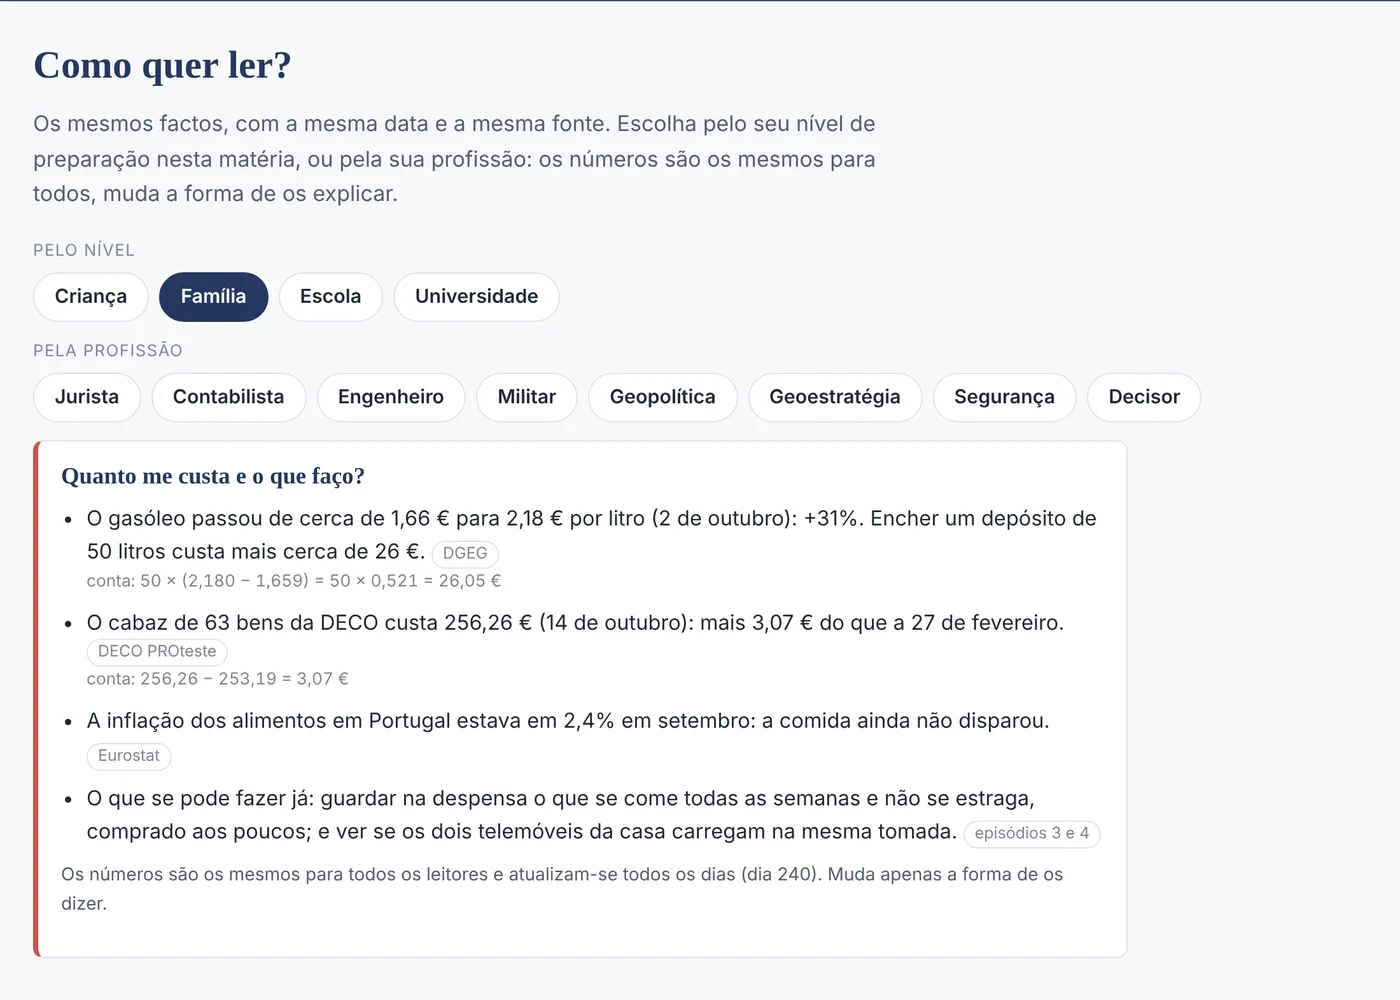
It is an image of the panel, just as the reader sees it. At the top you choose the level or the profession; below appear the sentences of that reading, each with its source (the grey label) and, when there is a calculated number, the calculation written out in full. If you choose “Geopolitics”, you read the order in which the confirmed effects reached each region; in “Security”, the incidents and the status of each fact. In no reading are there opinions, attributed intentions or culprits: only what was measured or confirmed.
The news that arrives on its own
The register of facts now has two RSS feeds, open and without registration. The first, factos.xml, sends an alert whenever a fact enters the register or changes status, with links to all the sources. The second, candidatos.xml, brings every day the news items the panel finds, in public aggregators, that may confirm or deny the reports not yet confirmed.
The candidates do not count as a source. An example from the first collection shows why: the aggregator presented, dated 25 October, a news item about attacks that cut Saudi output and the pipeline’s flow. Once the link was opened, the story was from April. Had it counted on its own, it would have confirmed the wrong fact with the wrong date. That is why each candidate stays in view, with a direct link, waiting for someone to read it, confirm that it says the same thing, about the same day, and that it comes from an independent source.
A witness who arrives quickly is worth no more than a witness who saw.
How to read the panel in five minutes
1. Open porta.aprecisa343.com and choose, under “How do you want to read?”, your level or your profession. 2. On the wave map, press ▶ and watch the wave move around the world, day by day, since 28 February. 3. On the wave clock, open “See the calculation, step by step” on a card and redo the calculation with your phone’s calculator. 4. In the Timeline, filter by “Under verification” and see what is not yet confirmed. 5. If you want to receive the changes without returning to the panel, copy the address of the RSS feed into your news reader.
Table 3 says when each signal changes. The next ones to watch: Eurostat’s flash inflation estimate at the end of October, which may show whether the 5th wave, that of dearer food, has begun; and the FAO index at the beginning of November, which says whether the 4th, that of cereals, is still rising.
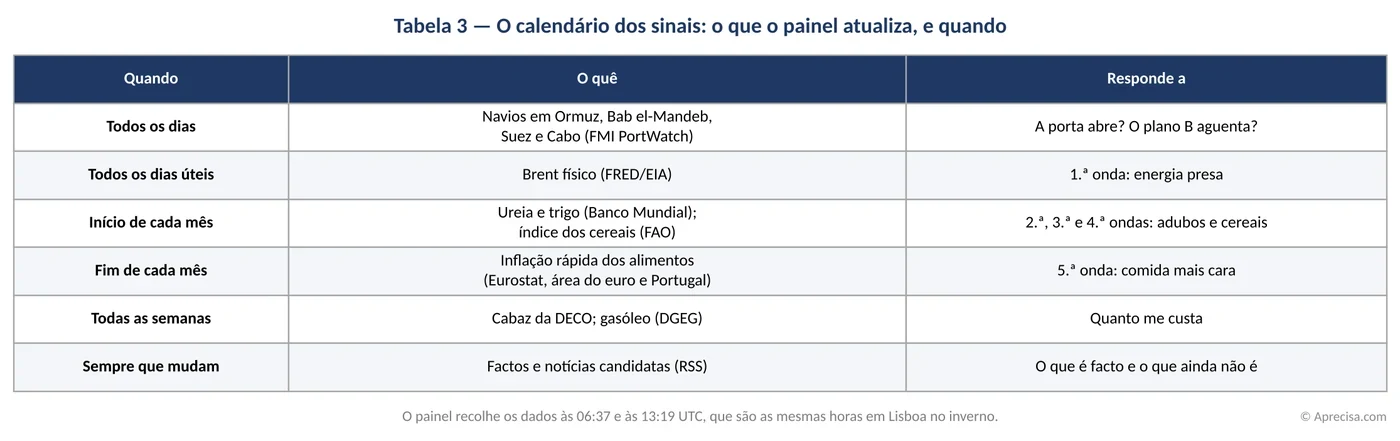
The first column says how often each source publishes; the second, what; the third, which question it answers. The daily data say whether the door opens; the monthly data say where the dominoes have got to. Anyone who only has five minutes a week can look only at the latest published line of each.
Your turn
1. Which of the eight questions did you choose at the start? Open the panel and check the answer with today’s figure. Write in the comments the number of the question and whether the answer was useful to you.
2. Choose your level or your profession on the panel. Was the explanation clear? Which number did you miss?
3. Fact F016, twelve ships attacked in the week to 16 October, needs a third independent source. If you find one, leave the link in the comments. If it meets the rule, it goes into the register, with the link you left.
In Póvoa, nobody thanks the flag. You look at it and decide: go out or stay. That is what the panel wants to be: not one more opinion about the crisis, but the flagpole where, every morning, you can see the state of the sea.
The next episode comes out on Tuesday, 3 November, day 248. Until then, the panel keeps answering.
Subscribe to the newsletter to receive each episode on Tuesdays.
Kind regards,
Gaspar do Amaral
Follow the waves, every day
The five waves of this series are measured every day on the Painel A Porta Estreita, with open data: the 1st, energy trapped (ships in Hormuz and Brent crude); the 2nd, dearer transport and fertiliser (price of urea); the 3rd, less fertiliser in the fields (urea compared with wheat); the 4th, smaller harvests and dearer cereals (FAO index); and the 5th, dearer food (food inflation and the DECO basket). Each number comes with its calculation done step by step, so that you can redo it with pencil and paper.
Think of a weather forecast: the article explains how storms form; the panel says what the weather is like today. And the series’ forecasts are recorded with the date on which they were made, so that the data themselves say whether they were right.
Open the panel · See whether the forecasts were right · For schools (in Portuguese)
Methodological note
About this translation. A translation of episode 5 of the newsletter “A Porta Estreita” (The Narrow Gate), published on this site on 27 October 2026 and then on LinkedIn; the full Portuguese version is on this site. The five figures and three tables of the original are reproduced as they are, with their texts in Portuguese and a translated caption; the numbering of the figures is that of the original. The decorative symbol (emoji) at the start of the second paragraph was left out. The panel’s pages are in Portuguese.
(1) “Day” means the full days since 28/02/2026, the date the strait closed to trade; 27/10/2026 is day 241.
(2) The data are those of the panel on 26/10/2026, with the latest value published by each source: IMF PortWatch to 18/10; FRED (physical Brent, series DCOILBRENTEU, from the EIA) to 20/10; World Bank, FAO and Eurostat to September; DECO on 14/10; DGEG on 2/10.
(3) The normal of each series is the average from 1/1/2026 to 27/2/2026; in the daily series, today’s value is the average of the last 7 published values; a wave arrives when it crosses the threshold for 7 days in a row (daily) or 2 months in a row (monthly). Thresholds: door, less than 0.5 × normal; Brent, more than 1.10 ×; urea and urea ÷ wheat, more than 1.15 ×; FAO cereals, more than 1.05 ×; food inflation, normal + 1 percentage point.
(4) All the calculations in the text are written out in full in the “The calculation, by hand” boxes; rounding to one or two decimal places at the end of each calculation.
(5) The 2025 average of traffic in Hormuz, 85.5 ships a day, is the average of the IMF’s 365 daily values for that year.
(6) Rule of facts: confirmed = primary source or 3 independent sources; 2 = under verification; 1 = report; publications that reproduce the same agency count as one source.
(7) The Póvoa harbour master’s office and the family with two tanks are illustrative examples. Text, figures and tables by the author, AI-assisted; Figure 6 is an image of the panel.
References
- Gaspar do Amaral — Dia 211: a porta estreita por onde passa a nossa resiliência — 27/09/2026 — episode 1 (in Portuguese).
- Gaspar do Amaral — Dia 220: O azar nunca vem só — 06/10/2026 — episode 2 (in Portuguese).
- Gaspar do Amaral — Dia 228: O efeito dominó — 14/10/2026 — episode 3, with forecasts P01 to P08 (in Portuguese).
- Gaspar do Amaral — As ondas pelo mundo e o seu plano — 19/10/2026 — complement to episode 3 (in Portuguese).
- Gaspar do Amaral — Dia 234: A ilusão de ter dois — 20/10/2026 — episode 4 (in Portuguese).
- Painel A Porta Estreita — updated daily — wave clock, map, matrix, timeline, forecasts and readings; method at porta.aprecisa343.com/metodo.html (in Portuguese).
- IMF — PortWatch — data to 18/10/2026 — daily transits of maritime chokepoints: Hormuz, Bab el-Mandeb, Suez, Cape of Good Hope.
- FRED / EIA — Europe Brent Spot Price FOB — data to 20/10/2026 — price of physical Brent (Europe Brent Spot Price FOB), series DCOILBRENTEU.
- World Bank — Commodity Markets (Pink Sheet) — October 2026 — urea and wheat, monthly prices.
- FAO — Food Price Index — 02/10/2026 — food price index and cereals index.
- Eurostat — HICP (prc_hicp_minr) — September 2026 — harmonised index of consumer prices: food, euro area and Portugal.
- DECO PROteste, via Folha Nacional / Lusa — 14/10/2026 — basket of 63 essential goods: €256.26 (in Portuguese).
- Contas Poupança — 02/10/2026 — average price of ordinary diesel in Portugal: €1.659 on 1/2/2026 (DGEG) (in Portuguese).
- O Digital (DGEG / ACP) — 02/10/2026 — average price of ordinary diesel: €2.180 per litre (in Portuguese).
- Saudi Press Agency (SPA) — 11/09/2026 — East–West pipeline stopped as a precaution after several attacks (Ministry of Energy).
- Türkiye Today / AFP — 05/10/2026 — East–West pipeline stops again after an attack on a pumping station near Khurais.
- Al Jazeera — 06/10/2026 — East–West pipeline: capacity of 7 million barrels a day.
- Al Jazeera — 17/10/2026 — at least 12 ships attacked in the week to 16/10 (UKMTO).
- Reuters, via ThePrint — 23/10/2026 — attacks on ships in Hormuz at an October high: 28 in October, 113 since 28/02 (Washington Institute); 135 incidents to 16/10 (UKMTO).
- Euro-Petrole / Edison — 29/09/2026 — QatarEnergy extends force majeure until the beginning of December 2026.
- Straits.live — daily brief, 25/10/2026 — Iranian reopening proposal reported (Laodong, ANI) and denied (Mehr); Brent at 116.72 dollars at Friday’s close.
- EnergyNow / Bloomberg — April 2026 — attacks cut Saudi output and the flow of the East–West pipeline (example of a candidate news item whose date was changed by the aggregator).
The discussion is on LinkedIn (in Portuguese)
Comments on this text are made on LinkedIn, where the article was shared in Portuguese. You are welcome to write in English. Agree, disagree or add data: every well-founded objection receives a reply.
Gaspar do Amaral · Original in Portuguese of 27 October 2026, published on this site; translation issued on 27 October 2026 · Figures and tables © Aprecisa.com · AI-assisted