 ← Grupo Aprecisa · Connecting those who know with those who need
Energy and the power system · Essay · Adequacy of the Iberian system
Two Hours in the Late Afternoon
What the tenth shutdown of Spanish industry reveals about the adequacy of the Iberian system — and why Portugal is not safe
Gaspar do Amaral · 9 October 2026
Translated from the Portuguese original. This version was issued on 27 October 2026.
On this site, this article has been
What happened and what is at stake
On Tuesday, 6 October 2026, at 19:43, in Spain, Red Eléctrica ordered a first group of large industrial plants to stop production. Nineteen minutes later, it gave the same order to a second group. In all, 1,775 MW of industrial demand left the grid for about two hours, according to the report in El Periódico de la Energía.
These were the tenth and eleventh activation orders of the Active Demand Response Service (SRAD, from the Spanish Servicio de Respuesta Activa de la Demanda) in 2026, across eight episodes in all, and the eighth and ninth since mid-July. At the same time, pumped storage was generating at full output and, according to the same report, exports to Portugal fell from about 4,000 MW to 400 MW.
The thesis of this text is simple. What failed was not energy; it was firm capacity for two hours a day. The SRAD worked as it should. The problem is that a mechanism designed to be rare has become routine, and that measures an adequacy margin that has narrowed.
In plain language. Imagine a house with solar panels and a family that all comes home at seven in the evening: oven, dishwasher, showers, television. The sun has just set. During the day there was energy to spare; at that hour there is not enough. Red Eléctrica did what a far-sighted parent does: it asked a neighbour with a workshop to switch off the machines for two hours, and paid him for it. It works. But if it has to be done eleven times in a year, the problem is no longer that evening. It is the house.
What the SRAD is
The SRAD is a balancing service in which large consumers are paid to be available to cut their consumption when the system operator asks. It has been running since 2022. It inherited the role of the old interruptibility service, but with a design closer to the market: capacity is allocated by auction and activation is paid at the price of tertiary regulation.
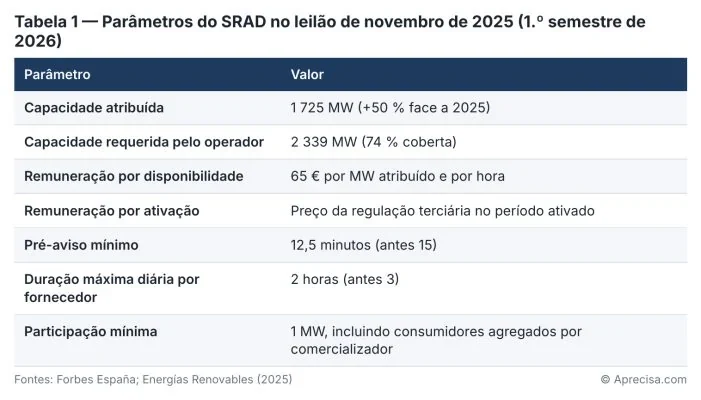
Table 1 shows two signals that the news report does not mention. First, the operator itself asked for 2,339 MW and only obtained 1,725 MW: the need for interruptible demand was already greater than the supply before the year began. Second, contracted capacity grew by 50% in one year. The operator foresaw the squeeze, and the squeeze arrived. In the second half of the year, the capacity allocated rose to 1,775 MW, at €42.62 per MW per hour, and all of it was activated on 6 October.
The European framework is Regulation (EU) 2019/943, which requires Member States to remove barriers to demand participation in balancing markets and defines resource adequacy as a responsibility to be assessed against an explicit reliability standard.
In plain language. The SRAD is like an insurance policy for a municipal swimming pool: the factory receives a small monthly fee for being ready to turn off its tap when the reservoir drops, and a little more each time it actually turns it off. The factory loses a few hours of production; the rest of the town keeps its water. It is a good deal for everyone — as long as it is used rarely.
The physics of the problem: the sunset ramp
What matters to the operator is not total demand but net load: demand minus wind and solar output, which cannot be dispatched. As a formula: net load = demand − solar − wind.
It is this net load that has to be covered, minute by minute, by dispatchable power stations, storage, interconnections or demand reduction. With a lot of photovoltaics, net load sinks in the middle of the day and rises sharply in the late afternoon, when the sun sets and household demand peaks. This is the so-called “duck curve”, described by the California operator in 2013 and analysed by NREL in 2015.
The critical requirement is twofold: the height of the net-load peak and the speed of the ramp, in MW per minute. On 6 October, both got worse at the same time. Sunset in Madrid was at about 19:50, wind was below 3 GW and part of the combined-cycle fleet was unavailable. The 19:43 activation happened exactly at the duck’s neck.
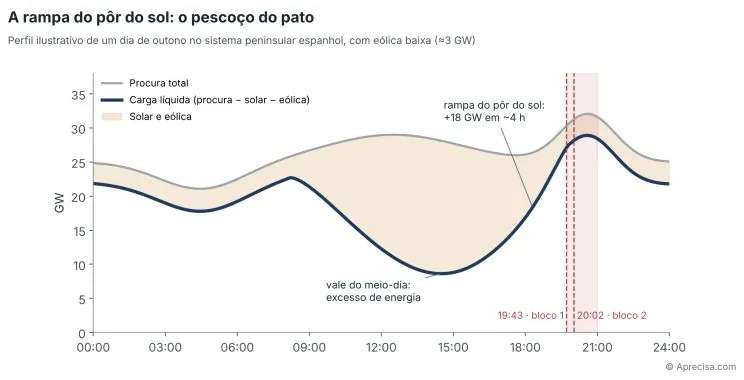
Figure 1 shows why the problem arises at that hour and not at midday. The grey line is total demand, which varies little over the day. The blue line is what is left for the dispatchable power stations after subtracting sun and wind. During the sunny afternoon, that need sinks; at sunset, it rises by about 18 GW in four hours. The red band marks the window in which the SRAD was activated: the point where the rise is fastest and household demand reaches its maximum. The profile is illustrative and does not reproduce the hourly data for 6 October.
Note the difference from the blackout of 28 April 2025. That was a stability problem: voltage control, in seconds. The one on 6 October is an adequacy problem: having enough capacity, in hours. They are two different frontiers of the same system, and they call for different instruments.
In plain language. Think of the queue in a supermarket. In the morning there are too many checkouts and few people. At seven in the evening everyone leaves work at the same time, and half the checkouts close because the morning-shift staff have already gone home (the sun). If the manager has no staff for the evening shift (power stations and batteries), all he can do is ask some customers to come back later (the SRAD). The problem is not that the supermarket has too few checkouts. It is that it has too few checkouts at that hour.
What the literature says
The case of 6 October is not a theoretical surprise. Each of its elements has been described in the literature and in official reports for more than a decade.
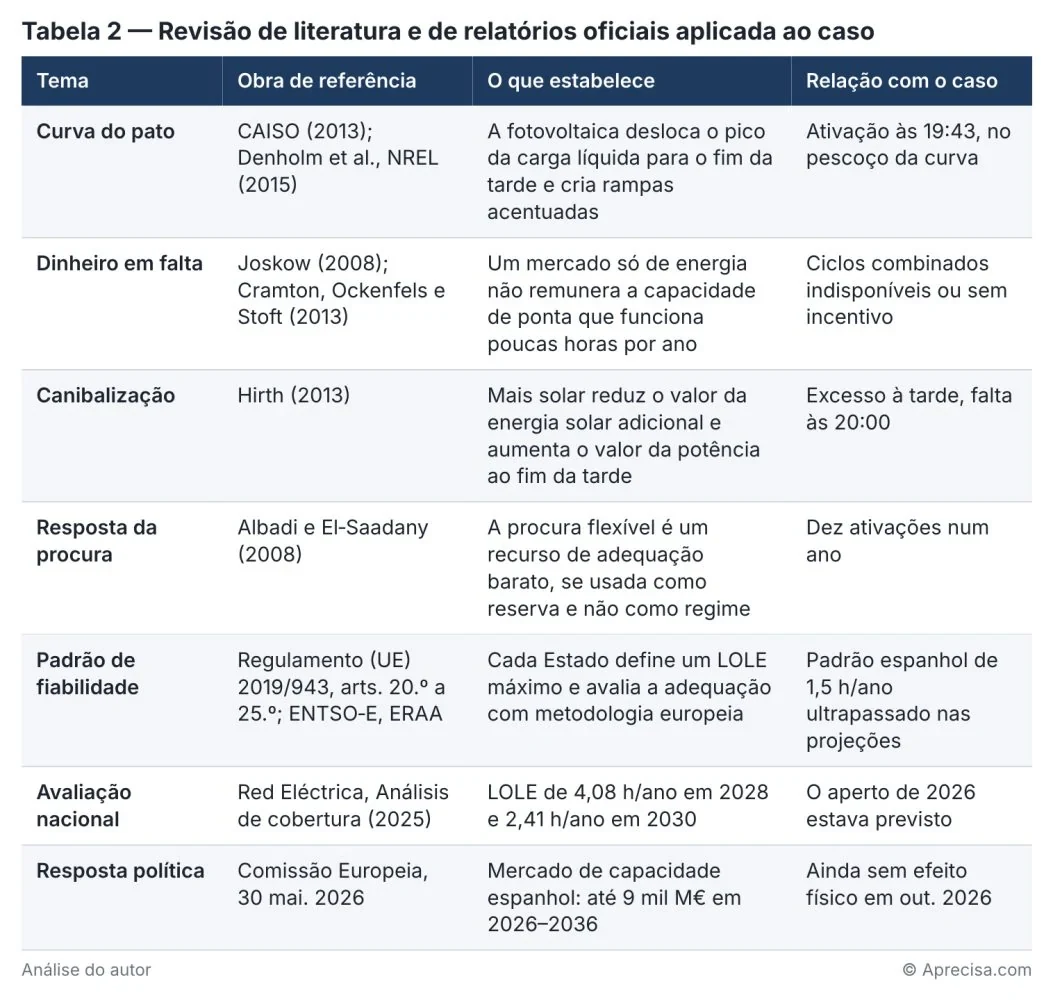
Table 2 shows a complete causal chain. The economic literature predicted that an energy-only market would stop paying for peak capacity. The technical literature predicted that solar would shift that peak to the late afternoon. The operator itself quantified, in 2025, that the reliability standard would be exceeded. And the policy response, the capacity market, was approved in May 2026, but the first auctions have not yet produced any power stations or batteries. The SRAD is filling the gap between the diagnosis and the construction work.
The value of 1.5 h/year deserves an explanation. LOLE is the expected number of hours per year in which supply is not enough to meet demand. A value of 4.08 h means almost three times the risk that the Spanish State itself defined as acceptable.
In plain language. Doctors have known for years that a patient with high blood pressure and cholesterol is at greater risk of a heart attack. The 2025 tests already showed it, and the treatment was prescribed in May 2026. But the medicine only takes effect in a few years. Meanwhile, the patient keeps having small scares — and the SRAD is the emergency pill he carries in his pocket. It works, but taking it every week is a sign that the underlying illness is still there.
The numbers and the layers of defence
The official e·sios data confirm the order of magnitude of the news report, but correct it on one point: the second block was not paid at €99/MWh, as was reported, but at about €201/MWh. And the cost of the activations is only the small part of the bill.
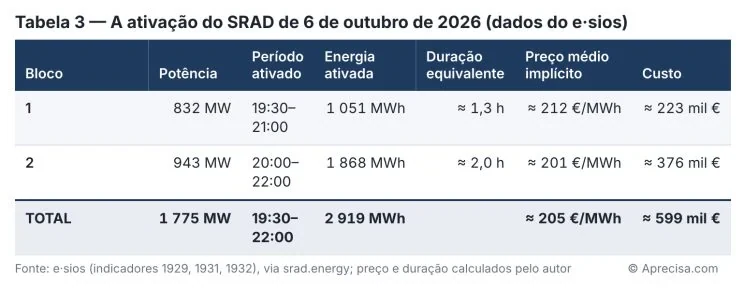
Table 3 shows that each activation costs relatively little: about €0.6 million for an evening on which 1.8 GW was taken off the grid. The big cost lies elsewhere, in the availability payment, which is paid for every hour in which industry is ready to stop, whether it stops or not. In the second half of 2026, at €42.62 per MW per hour, for 1,775 MW and about 2,170 hours of availability, the estimate comes to around €164 million: more than forty times the cost of all the year’s activations. In the first half, at €65/MW/h for 1,725 MW, the estimate comes to around €237 million, assuming the same time window. The method is explained in the methodological note.
Comparing this figure with the cost of peaking plants or batteries calls for a study of its own, which this article does not carry out. What the numbers show is that adequacy is already being paid for, and it is not cheap. An insurance policy designed to be rare has become, at the same time, expensive and frequent.
What is worrying is the sequence of resources mobilised in that hour:
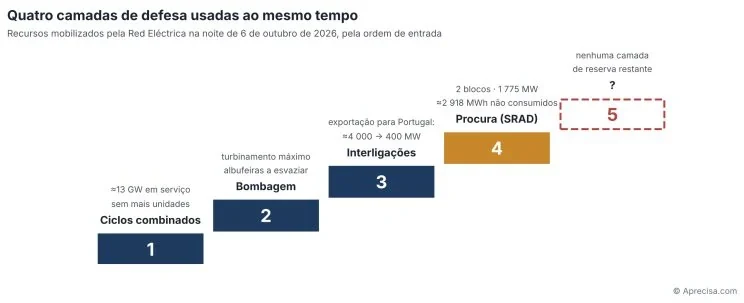
Figure 2 shows the resources used by Red Eléctrica as the steps of a staircase, in the order in which they came in: combined cycles at their limit, pumped storage at maximum, exports cut and, finally, industrial demand. The fifth step, dashed, is the one that did not exist: if a power station had tripped at that hour, there would have been no other layer to turn to. The message is that security was maintained by using up the margin, not with margin to spare.
The statement that “there was no risk to supply” is true at that instant. But it was achieved by using four layers at the same time. If, at that hour, a 400 MW unit had tripped, there would have been no fifth layer.
In plain language. Imagine you drive to an important meeting and arrive on time. But to do so you used the spare tyre, the emergency cash, asked a neighbour for a lift and phoned to say you would be five minutes late. You arrived, yes. The right question is not “did you arrive?”, but “what would have happened if one more thing had gone wrong?”.
It was not one evening: it was eight
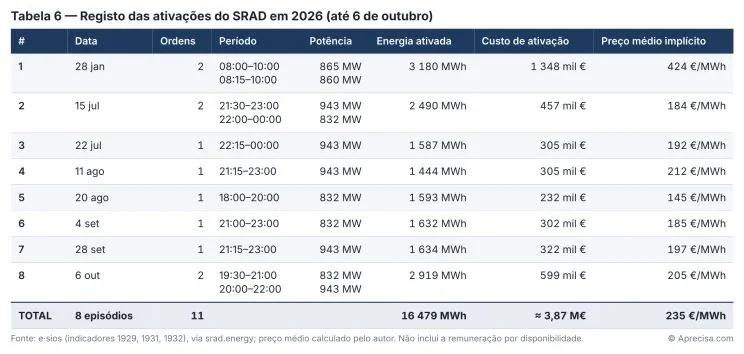
The evening of 6 October is not an isolated case. The e·sios data record eleven SRAD activation orders in 2026, spread over eight episodes: 16,479 MWh of industrial demand taken off the grid and about €3.9 million paid in activations. The full record is in Table 6, in the annex. Ten of the eleven orders fell between 18:00 and midnight.
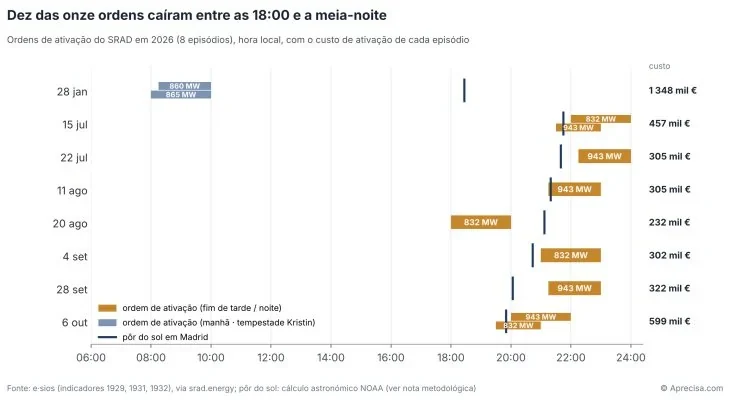
Figure 3 puts each episode on a line and each activation order at the hour in which it was in force; the blue mark shows sunset in Madrid on that day. The message is immediate: except for 28 January, a stormy morning on which wind output suddenly dropped, all the orders cluster around sunset and the hours after it. The system does not fail at random. It always fails in the same window, that of the late-afternoon ramp described in Figure 1. The €3.9 million refers only to the activations; the availability payment is paid separately and is much larger, as seen in the previous section.
In plain language. Imagine a restaurant that, eight times this year, has had to ask customers to wait at the door. Never at lunch, never in mid-afternoon: always at dinner. It is not bad luck. It is a lack of tables at that hour. And the solution is not to pay the customers more to wait; it is to have more tables for dinner.
What it means for Portugal
For Portugal, the most important piece of data in the news report is an almost hidden line: according to the Spanish press, exports to Portugal fell from about 4,000 MW to 400 MW in minutes.
Portugal imports from Spain mainly outside the sunny hours, precisely when the Spanish system is also at its tightest. This is a structural correlation, not a coincidence. The Iberian Peninsula shares the same sun, the same Atlantic wind and the same dinner time. When Spain is short of capacity at 20:00, Portugal is probably short too.
The relationship is symmetrical. On 28 January 2026, during Storm Kristin, it was Portugal that cut its exports to Spain by 1,500 MW in one hour, which contributed to one of the first SRAD activations of the year. Each operator protects its own system first, as Regulation (EU) 2017/1485 requires.
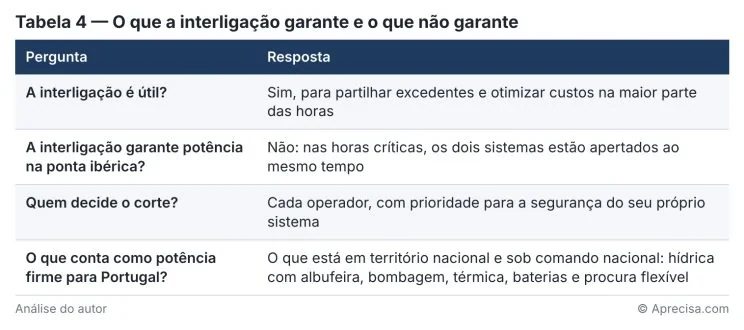
Table 4 sums up the lesson. Adequacy through imports is conditional, not firm. Portugal should count on Spain to optimise, but not to guarantee the peak. This is not an argument against interconnection. It is an argument against presenting it as a shield.
In plain language. Two neighbours share a generator in an apartment block. On most days it works well: when one does not need it, the other uses it. But when the power goes off in the whole neighbourhood, both need the generator at the same time, and whoever has the generator in their garage switches it on at home first. Counting on your neighbour’s generator is great for saving money. For the difficult nights, every home needs its own torch.
What should be done
The SRAD is not the problem. It is the only instrument that was already ready. The problem is what is missing around it.
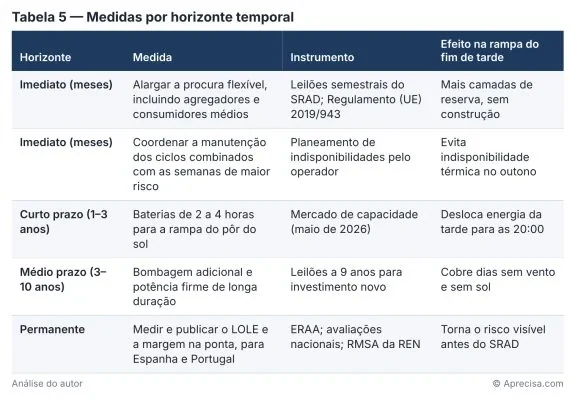
Table 5 orders the measures by the time they take to have an effect. The first two can be applied straight away and cost little. The next ones require investment, and that is where it will be decided whether the SRAD becomes rare again.
For Portugal, the consequence is direct. Without an adequacy assessment that treats imports as conditional, and without firm capacity and storage under national control, the country is left dependent on the margin of a neighbouring system that, in the same hours, is using up its last reserves.
Conclusion
The eleven orders to stop Spanish industry are not a payments scandal. They are a thermometer. They measure, hour by hour, the distance between a system that has grown in cheap energy at midday and a system that has not grown in firm capacity in the late afternoon.
The cost of adequacy, unlike the cost of stability, already has a price and is already paid to those who provide the service. What remains to be paid for is the construction work that makes the service rare. Meanwhile, Portugal should learn from the two hours of 6 October: an interconnection links systems, but it does not lend capacity that the neighbour does not have.
In plain language. When the warning light on the car’s dashboard comes on every week, the problem is not solved by paying the tow truck more. You take the car to the garage. The SRAD is the tow truck: it is good to have it, but the monthly fee is no longer cheap. Only the garage — batteries, pumped storage, firm capacity — turns the light off.
Gaspar do Amaral
Annex — Record of the 2026 activations
Table 6 brings together the eleven SRAD activation orders recorded in e·sios up to 6 October 2026. The implied average price of the January episode, about €424/MWh, reflects the urgency of a stormy morning; the late-afternoon episodes were between €145 and €212/MWh.
Annotated references
- El Periódico de la Energía (07/10/2026), Ramón Roca — report on the tenth SRAD activation order; source of the times of the orders (19:43 and 20:02) and of the cut in exports to Portugal.
- srad.energy — SRAD: ativações, custo e fornecedores — unofficial compilation of the e·sios indicators (1929, 1931, 1932); source of Table 3.
- Forbes España — REE contará com 1 725 MW de consumo no primeiro semestre — results of the SRAD auction for 2026.
- Xataka — Apagar fábricas para evitar apagões já custa quase 1 000 milhões aos espanhóis — cumulative fixed payment of €954 million since 2022 and an estimate of about €434 million for 2026.
- El Independiente (29/01/2026) — Red Eléctrica e o «botão de paragem» da indústria — about €1.4 million a day; just over €310 million in 2025; €255 million in the first half of 2026.
- Ingeniería Prodesa — SRAD 2026: flexibilidade industrial — estimate of about €256 million (1st half) and €179 million (2nd half, 2,358 h).
- Red Eléctrica — Comunicado do leilão do SRAD para o 2.º semestre de 2026 (28/05/2026) — 1,775 MW at €42.62/MW/h; availability window.
- Red Eléctrica — Comunicado do leilão do SRAD para o 1.º semestre de 2026 (28/11/2025) — 1,725 MW at €65/MW/h.
- Energías Renovables — SRAD, el sistema de respuesta activa de la demanda — rules of the service and changes approved by the CNMC.
- Maldita.es — Espanha esteve à beira de um segundo apagão a 28 de janeiro de 2026 — Storm Kristin, the drop in wind output and the reduction in Portuguese exports.
- Red Eléctrica — Análisis de cobertura 2025 — LOLE projected above the 1.5 h/year standard in 2028 and 2030.
- pv magazine — A Comissão aprova o mercado de capacidade para Espanha (30/05/2026) — up to €9 billion in 2026–2036.
- ENTSO-E — ERAA 2025, relatórios e resultados — European resource adequacy assessment.
- Postal do Algarve — Portugal volta a importar mais eletricidade de Espanha, mas só fora do horário solar — import limits after the 2025 blackout.
- Regulamento (UE) 2019/943 (EUR-Lex) — resource adequacy, reliability standard and demand participation.
- Denholm, P. et al. (2015), Overgeneration from Solar Energy in California: A Field Guide to the Duck Chart, NREL/TP-6A20-65023 — reference analysis of the duck curve.
- Joskow, P. (2008), Capacity payments in imperfect electricity markets: Need and design, Utilities Policy 16 — the missing-money problem.
- Cramton, P., Ockenfels, A. e Stoft, S. (2013), Capacity Market Fundamentals, Economics of Energy & Environmental Policy 2(2) — fundamentals of capacity markets.
- Albadi, M. e El-Saadany, E. (2008), A summary of demand response in electricity markets, Electric Power Systems Research 78 — typology and value of demand response.
- Hirth, L. (2013), The market value of variable renewables, Energy Economics 38 — cannibalisation of the value of solar energy.
Illustrations and tables: © Aprecisa.com, AI-assisted.
Methodological note
Everything in this article that is not published data, but a calculation or construction by the author, is identified below.
1. Activation data (Tables 3 and 6, Figure 3). The power, period, energy and cost of each order come from e·sios indicators 1929 (power activated), 1931 (energy) and 1932 (payment entitlements), compiled by the unofficial site srad.energy. The times of the orders (19:43 and 20:02) and the cut in exports to Portugal come from the El Periódico de la Energía report and have not been confirmed in e·sios.
2. Derived quantities. Equivalent duration = energy activated ÷ power. Implied average price = activation cost ÷ energy activated. The totals are simple sums. None of these values is published by the operator.
3. Estimate of the availability payment. Cost ≈ capacity allocated × availability price × hours of availability. For the second half of 2026: 1,775 MW × €42.62/MW/h × 2,174 h ≈ €164 million. The hours result from the window published by Red Eléctrica (working days from 8:00 to midnight, 16 h; weekends and national holidays from 22:00 to 23:59, 2 h): 129 working days and 55 other days between 1 July and 31 December. For the first half: 1,725 MW × €65/MW/h × 2,112 h ≈ €237 million, assuming the same window, which the press release for that auction does not specify. The estimate assumes that all the capacity is paid in every hour of the window; the real value may be lower if there are unavailabilities or penalties. It is an order of magnitude, not an accounting figure. Independent estimates published in the Spanish press point to values of the same order: about €256 million in the first half and €179 million in the second, about €434 million for 2026 as a whole, and €954 million of cumulative fixed payment since 2022. The difference from the author’s estimates comes mainly from the number of hours of availability assumed (for example, 2,358 h in the second half, against 2,174 h).
4. Sunset (Figure 3 and text). Calculated with the NOAA simplified solar algorithm for Madrid (40.42° N, 3.70° W), converted to Spanish official time (CET in winter, CEST in summer). The accuracy is one to two minutes. The value for 6 October, 19:49, is the one used in the text as “about 19:50”.
5. Figure 1. An illustrative profile built by the author, with synthetic demand, solar output and wind output (constant wind of about 3 GW). It serves to show the shape of the duck curve and does not reproduce the hourly data for 6 October. The values shown on it, such as the rise of about 18 GW in four hours, belong to the illustrative profile.
6. Figure 2. A qualitative diagram of the sequence of resources mobilised, based on the news report and the e·sios data. The order of the steps is interpretative.
7. Counting the activations. An “order” is each activation instruction to a block; an “episode” is each day with one or more orders. Up to 6 October 2026 there were eleven orders in eight episodes.
About this translation. A translation of the article the author published on LinkedIn on 9 October 2026; the full Portuguese version is on this site. The nine original images (Tables 1 to 6 and Figures 1 to 3) are reproduced with their texts in Portuguese and a translated caption. Titles of sources stay as in the original; the links are those of the original.
The discussion is on LinkedIn (in Portuguese)
Comments on this text are made on LinkedIn, where the article was shared in Portuguese. You are welcome to write in English. Agree, disagree or add data: every well-founded objection receives a reply.
Gaspar do Amaral · Original in Portuguese of 9 October 2026, published on this site; translation issued on 27 October 2026 · Figures and tables © Aprecisa.com · AI-assisted