 ← Grupo Aprecisa · Connecting those who know with those who need
Engineering · Water · Opinion
When the Rain Fails the Grid
Water and hydropower in 214 countries, measured with the same yardstick
Gaspar do Amaral · 11 October 2026
Translated from the Portuguese original. This version was issued on 27 October 2026.
On this site, this article has been
June 2022. In a dispatch centre, the reservoir screen shows what the calendar had already announced: the month’s hydroelectric production capability index stands at 0.24 — a quarter of what the fleet would produce in a normal June, the lowest value for that month since 1971. In the first half of the year, natural gas covers 31% of consumption and imports 21%, both half-yearly highs. On the other side of the border, Spanish hydro output will close the year down 39.7%; in the European Union, down 19%. In France, that same summer, reservoirs are historically low and river temperatures force nuclear power stations to cut output.
Nobody in that room needs to be told what a drought is. They need to know something else: how much of the country’s electricity depends on rain, how much is missing in the worst year, and what the grid has to cover it. It is a simple question, and none of the indicators usually quoted answers it.
Water is the only fuel that cannot be ordered: it either arrives or it does not. And it enters the electricity system in two ways that are rarely measured together. Through the turbine, as energy and as storage. And through the cooling tower, the desalination plant and the pumping station, as a resource that electricity consumes and that consumes electricity.
This article applies to that double role the same yardstick (a mesma régua) I used for electricity systems: a panel of 214 countries and territories, built from open sources, organised by time scales and with no aggregate score. First, the world water system in numbers. Then, the water clocks — the hours, the year, the decades, availability, service and the nexus. Finally, Portugal with the same yardstick.
In plain language: A dam is at the same time a power station, a battery and a water tank. In a rainy year, the three functions live side by side. In a dry year, they compete — and it is in that year that you see whether the system was properly measured.
I. More energy than ever, less weight than ever
At the end of 2025, the world had 1,469 GW of hydroelectric capacity, of which 201 GW was pumped storage, according to the World Hydropower Outlook 2026 of the International Hydropower Association (IHA). In 2025, 28 GW entered service, of which 11.7 GW was pumped storage — a record. Output also broke records: 4,495 TWh according to the IHA, 4,437 TWh according to Ember. But the share of hydropower in world electricity generation fell to 14%, the lowest value on record; in 2020 it was 17%.
There is no contradiction. Demand and wind and solar output grow faster than hydro, and new hydro capacity is increasingly pumped storage, which shifts energy instead of producing it. Of the world project pipeline, 1,127 GW, more than half is pumped storage. The system value of hydro is moving from energy towards storage and capacity.
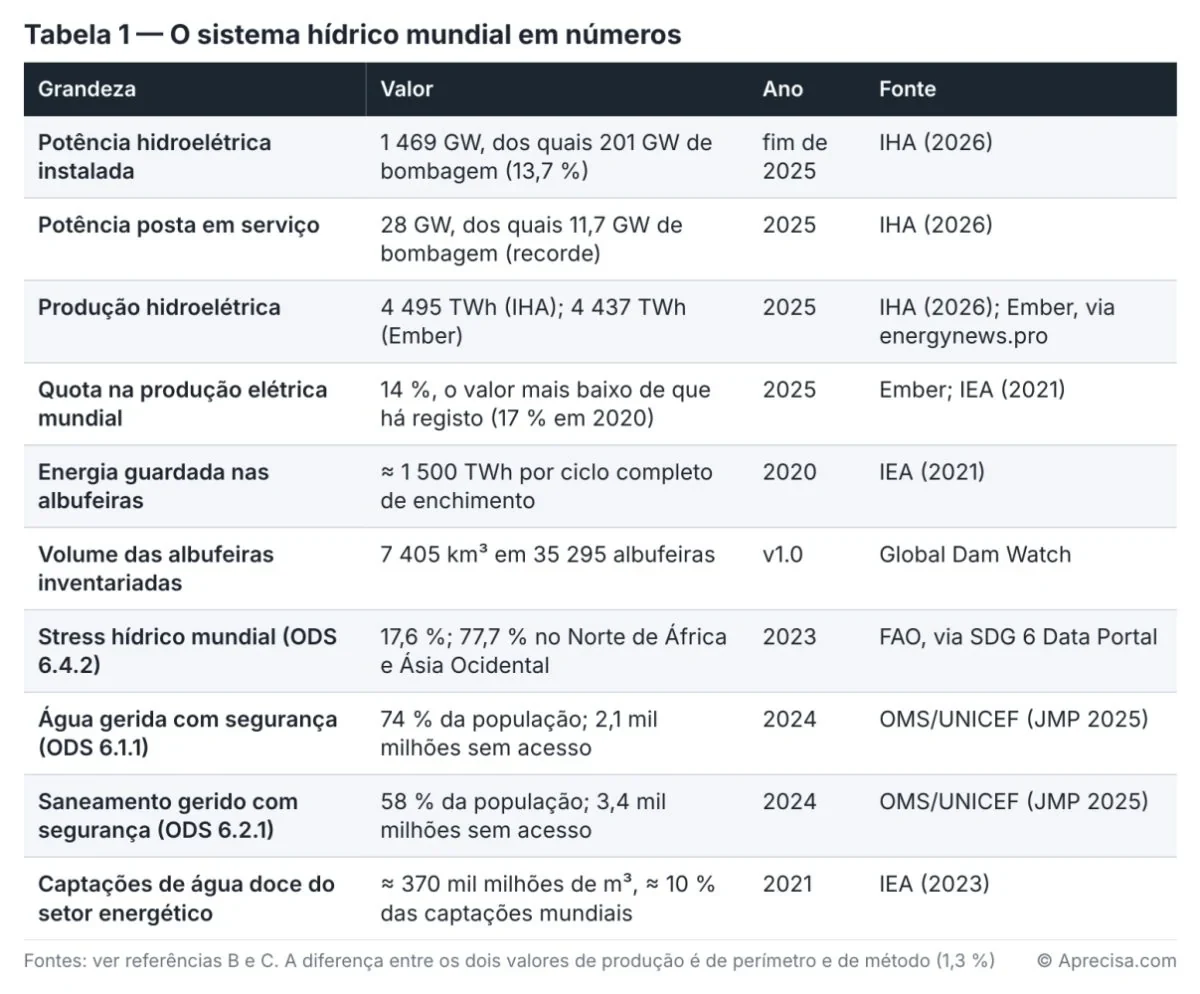
Table 1 gathers the reference values. Two of them separate orders of magnitude that public debate confuses. The world’s reservoirs hold about 1,500 TWh per full filling cycle: this is seasonal and multi-year storage, on the TWh scale. Pumped storage and batteries are daily and weekly storage, on the GWh scale. They do not replace each other, and they are not measured in the same column.
The 1.3% difference between the two production values also holds a lesson. It is a difference of scope and method between two serious sources. In a comparative table, mixing them is enough to create between two countries a difference that exists in neither. That is why the panel uses the IHA for capacity and pumped storage, and Ember, through Our World in Data, for output — never the two in the same column.
II. The water clocks
Like the electricity system, water obeys several clocks. In the hours, the question is whether there is storage to shift energy from some hours to others. In the season and the year, it is how much the fleet produces in a dry year. In the decades, it is whether the fleet and the reservoirs are being renewed and what the climate will do to run-off. To these three clocks are added four dimensions specific to water: availability, service to the population, the border and the nexus with energy.
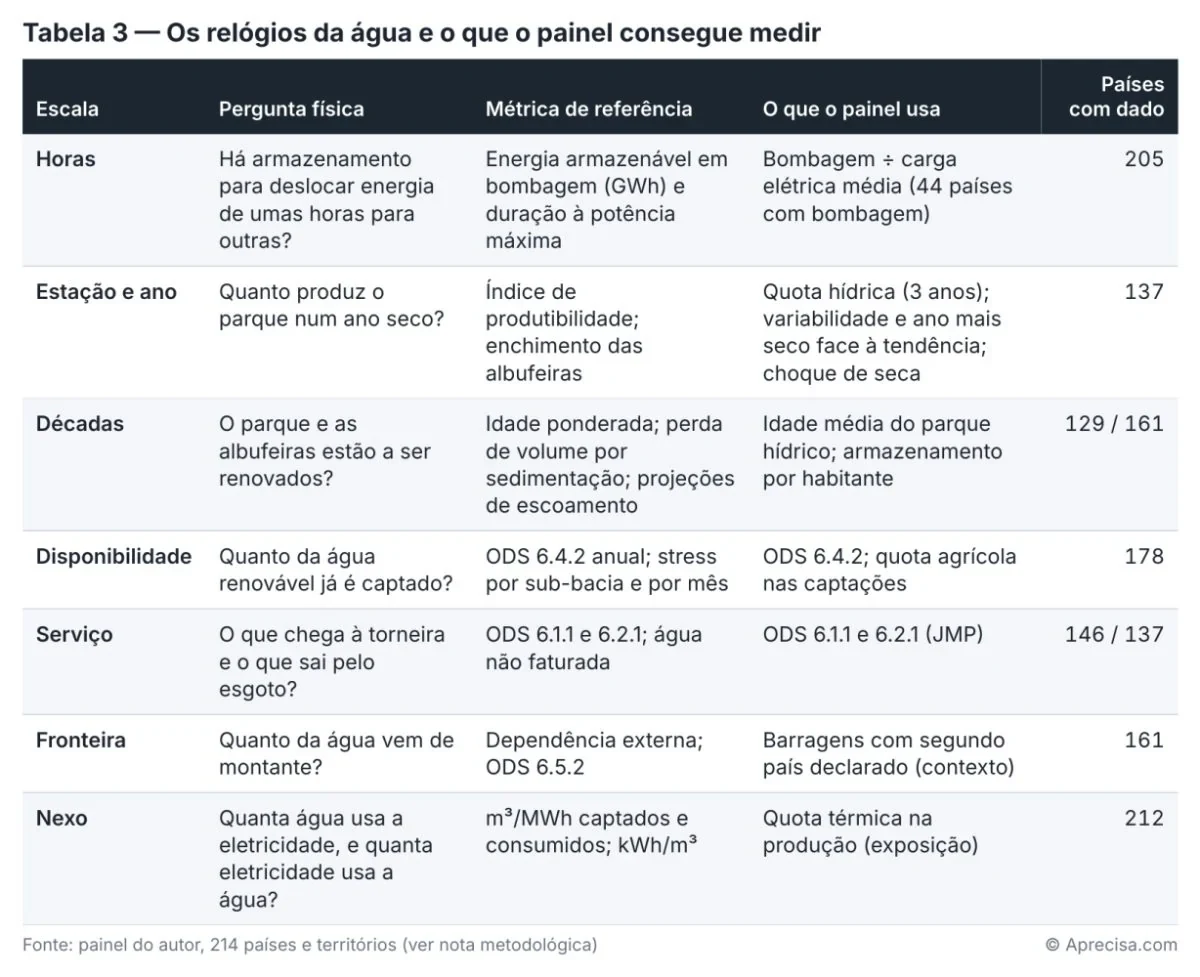
Table 3 crosses each scale with the reference metric and with what it was possible to measure for 214 countries and territories. To build the panel I brought together seven primary sources: the country annex of the IHA’s World Hydropower Outlook 2026; the Our World in Data generation series, which aggregates Ember and the Energy Institute; the Global Energy Monitor power plant inventory; the Global Dam Watch database of dams and reservoirs; FAO AQUASTAT, which is the source of indicators 6.4.1 and 6.4.2 of the Sustainable Development Goals (SDGs); the world file of the WHO/UNICEF Joint Monitoring Programme (JMP); and, for the nexus factors, the review by Macknick and colleagues. The result is a spreadsheet with one row per country, 30 numerical indicators, the year and source of each column, and the formula of each calculation.
The last column shows the same asymmetry as the electricity panel. What is annual is almost complete. What is decided in the hours — the energy that can be stored in pumped storage, in GWh — has no open world source, and the panel uses a declared proxy, pumping capacity divided by the average electrical load. Also left out are stress by sub-basin and by month, for which country data were not obtained, and dependence on flows coming from upstream.
In plain language: We know how much water each country withdraws per year and how much electricity its dams produce. We know much less about what happens in the dry month, in the stretched basin and at the peak hour — which is where crises happen.
III. Season and year: the drought shock
Hydrological variability is the structural weakness of the electrical face of water, and recent years have given it numbers. Table 2 brings together nine documented events between 2021 and 2024.
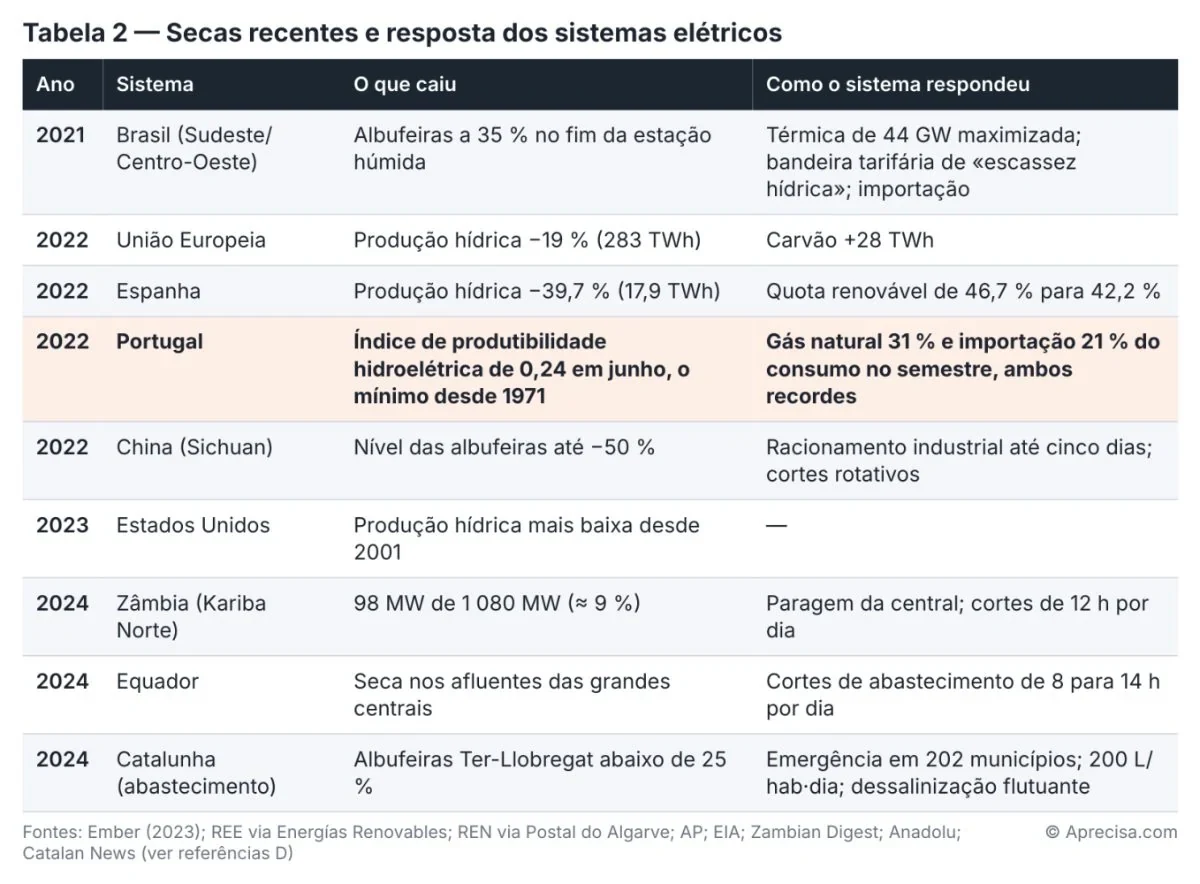
Table 2 shows a pattern that repeats itself. When water runs short, systems always respond in one of three ways: with thermal reserve, like the European Union, which burnt an extra 28 TWh of coal in 2022; with imports, like Portugal and Brazil; or with rationing, like Sichuan, Zambia and Ecuador. The systems that ended up rationing have in common a high hydro share and little thermal reserve or interconnection.
No source publishes, by country, how much hydro output is missing in a dry year. I calculated it. The direct calculation — the coefficient of variation of annual output — has a flaw: a fleet that grows looks variable without any less rain falling. Nepal and Lesotho, which put new power stations into service in the last decade, appeared among the most “unstable” systems in the world for that reason. The correction is to remove the trend. For each country, I fitted a straight line to hydro output from 2015 to 2024 and divided each year’s output by the value of the line:

The ratio rt equals 1 in a normal year for the existing fleet; below 1, the year was dry. The standard deviation of the ratios measures hydrological variability, and the lowest ratio of the decade measures the driest year. Multiplying that year’s shortfall by the three-year hydro share gives the fraction of the country’s electricity that disappears in the worst year of the decade — and that has to be covered by thermal power, imports or cuts:

It is not an index: it is a derived physical quantity, as a percentage of electricity generation, with both factors visible.
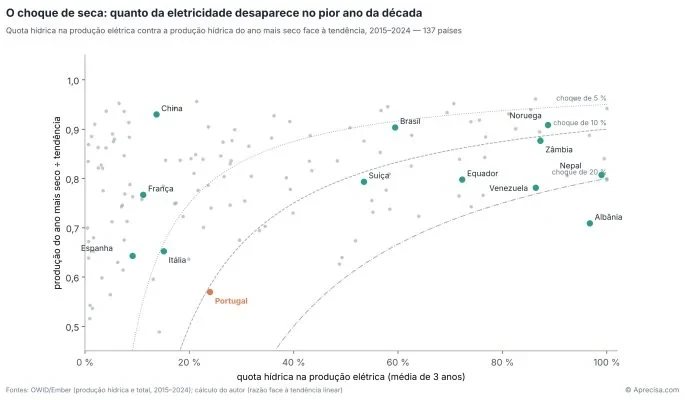
Figure 1 shows 137 countries, with the hydro share on the horizontal axis and output in the driest year, relative to the trend, on the vertical axis. The dashed curves are the lines of equal shock: 5, 10 and 20% of electricity generation. The world median of variability is 0.115, and that of the shock is 4.6%. Albania, with 97% hydro and a dry year at 0.71, loses 28% of its electricity in the worst year of the decade; Bhutan, Lesotho and Nepal, almost entirely hydro, lose about 20%. Norway, with 89% hydro, stays at 8%, because its worst year was at 0.91 of the trend. The figure also shows a regularity: countries with more hydro tend to have less variable output (Spearman correlation of −0.34, across 137 countries). The likely explanation, which I have not tested, is that large hydro systems have several basins and a great deal of storage, and a drought rarely hits them all at the same time. Portugal, in orange, combines a moderate share (24%) with the deepest dry year among European systems with significant hydro (0.57) and stands at 10.3%.
Worldwide, 45 countries produce more than half of their electricity from water, and 9 produce more than 90%. For them, rain is a security-of-supply variable, and the response to drought is decided at the electrical border and in the thermal fleet — two variables that are in the electricity sheet and not in the water sheet. The two sheets have to be read together.
In plain language: The drought shock answers the question: if this year it rains as in the worst year of the last decade, what part of the country’s electricity has to come from elsewhere? In Albania, more than a quarter. In Portugal, a tenth. In Norway, less than a tenth, even though almost everything is hydro.
IV. Hours: from power station to battery
On the scale of hours, hydro has another function: that of a battery. A pumped-storage station pumps water up to the upper reservoir when electricity is in surplus and runs it through the turbines when it is short. The right physical metric is the energy that can be stored, in GWh, and the duration at maximum power; but that quantity is not published in a comparable way for almost any country. The panel therefore uses pumping capacity divided by the average electrical load — annual demand divided by 8,760 hours. It is power, not energy, and the label says so.
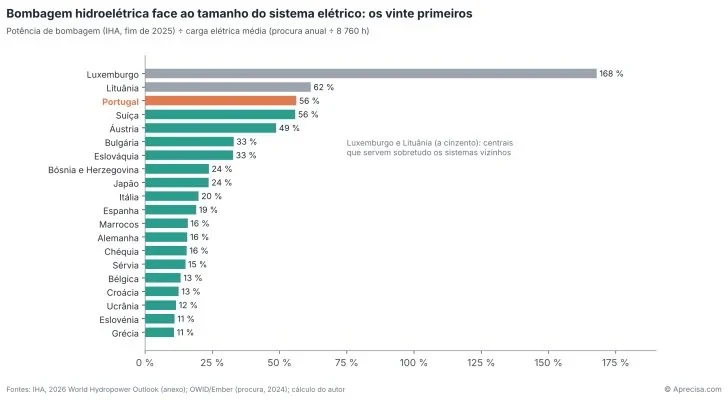
Figure 2 ranks the twenty systems with the highest ratio between pumping capacity and average load, among the 44 that have pumped storage. Luxembourg and Lithuania, in grey, are at the top for reasons that are not their own: the Vianden and Kruonis plants mainly serve neighbouring systems. Leaving out those two cases, Portugal, in orange, has the highest ratio in the world: 56.2% of average load, ahead of Switzerland (55.9%) and Austria (48.8%). All three are small, mountainous and strongly interconnected systems. China, with the largest absolute pumping capacity, stands at 6%, because the denominator is the largest electricity system in the world.
What this means is that in Portugal hydro is no longer mainly a source of energy: 44% of national hydro capacity is reversible, against 13.7% worldwide. The Tâmega complex added 1,158 MW and 40 GWh of storage — about 35 hours at full power. This is the scale of hours, and Portuguese hydro lives in it more and more.
V. Decades and availability: dams store water, they do not create it
Global Dam Watch lists 35,295 reservoirs holding 7,405 km³. Dividing the volume of each country’s reservoirs by its population gives storage per inhabitant: from less than one cubic metre in the United Arab Emirates to more than 35,000 in Suriname, with a world median of 361. Portugal stores 1,380 m³ per inhabitant, in 145 dams, most of them built for electricity generation.
The temptation is to read storage as water security. Figure 3 shows why one should not.
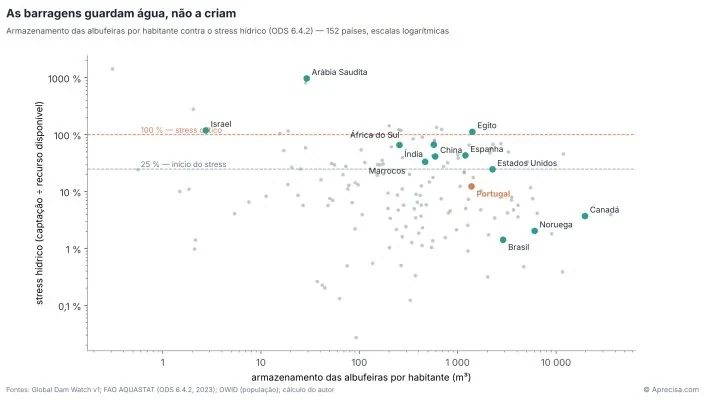
Figure 3 crosses storage per inhabitant with water stress under SDG 6.4.2 — the ratio between freshwater withdrawn and renewable resources, after deducting environmental flows — for 152 countries, both on logarithmic scales. There is no relationship: the Spearman correlation is −0.12, statistically nil. Egypt, with the Aswan dam, stores 1,410 m³ per inhabitant and withdraws 113% of its renewable resources; Norway stores more than 6,000 m³ and withdraws 2%. Dams shift water in time — from the wet season to the dry, from the wet year to the dry one — but they do not increase what reaches the basin. Where more is withdrawn than the river brings, no reservoir solves it.
Worldwide, according to the FAO, average water stress is 17.6%, but in North Africa and Western Asia it reaches 77.7%. In the panel, 16 countries are in critical stress, above 100%, with 411 million inhabitants; 23 are above 75%; and about 2.5 billion people live in countries whose national average exceeds 50%. Agriculture accounts for 72% of world withdrawals. And all these numbers are national and annual averages: the stress that interrupts supply is that of a sub-basin in a summer month, and that cannot be seen in the average.
In plain language: A dam is a piggy bank, not a salary. It lets you spend in summer what you saved in winter, but it does not increase what comes in. A country that spends more water than the rain gives it will not be saved by more piggy banks.
VI. Service: what reaches the tap
The service face is the best measured in the world, thanks to the JMP. In 2024, 74% of the world population had safely managed water — at home, available when needed and free from contamination — and 58% had safely managed sanitation. Even so, 2.1 billion people lack the first and 3.4 billion lack the second. In the panel, 42 of the 146 countries with data fall below 50% safely managed water.
Portugal has 95.2% safely managed water and 93.9% safely managed sanitation, according to the JMP. The national regulator, ERSAR, publishes 99% “safe water”. The two values do not contradict each other: they measure different things. ERSAR measures the quality of the water supplied by public systems; the JMP measures the population, including those not connected to the public network. It is the oldest rule of the same yardstick: a number is not compared with another without knowing what each one counts.
VII. The nexus: withdrawal is not consumption
Water goes into electricity and electricity goes into water. Table 4 shows both directions with the reference values.
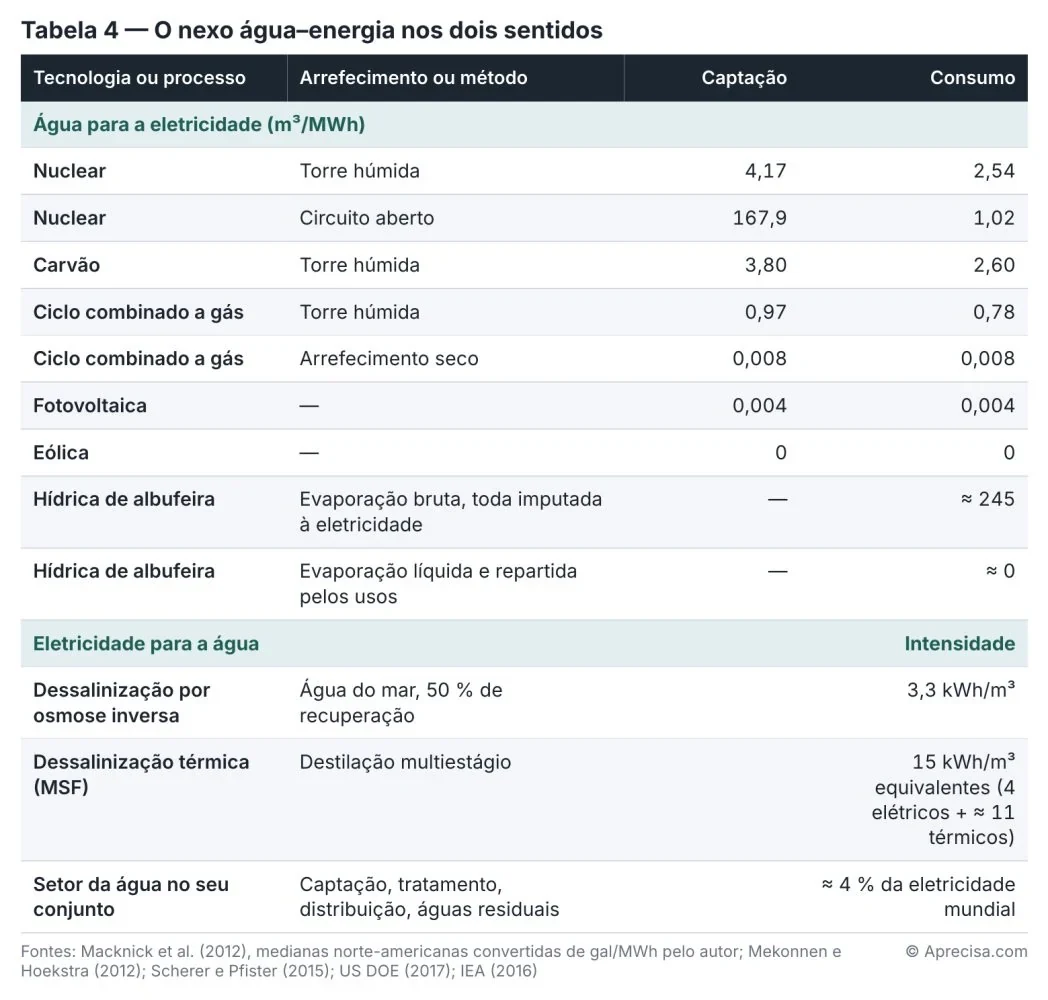
Table 4 holds two lessons of method. The first is in the two columns at the top: withdrawing is not consuming. A nuclear power station with once-through cooling withdraws about 168 m³ per MWh and returns almost all of it to the river, warmer; with a wet tower, it withdraws 4 m³ but evaporates 2.5. Changing the cooling trades withdrawal for consumption. Adding the two quantities, or comparing one country’s withdrawal with another’s consumption, is the most frequent error in nexus comparisons. Solar photovoltaics and wind are three to four orders of magnitude below any thermal plant.
The second lesson is in the two hydro rows. Attributing all of the reservoir’s evaporation to electricity, hydro “consumes” about 245 m³ per MWh, a hundred times more than a thermal plant with a tower. Deducting the evaporation that already existed before the dam and sharing the rest among the uses of the reservoir — irrigation, supply, flow regulation — the value approaches zero. The method decides the result by three orders of magnitude. A table that does not declare its method measures the convention, not the system.
In the opposite direction, reverse-osmosis desalination uses about 3.3 kWh per cubic metre, and the water sector as a whole about 4% of world electricity. The order of magnitude is instructive for Portugal. The Algarve desalination plant, contracted in 2024 for about 16 hm³ a year, will need about 53 GWh a year — 0.1% of national electricity consumption, but a significant load for the regional grid. And the roughly 190 hm³ of non-revenue water that ERSAR records each year are worth twelve times the capacity of the desalination plant. The cheapest cubic metre is the one that is not lost.
In plain language: A power station that takes water from the river and returns it lukewarm is not the same as one that evaporates it. The first “uses” a lot of water and “spends” little; the second uses little and spends almost all of it. Whoever compares the two with the same number is comparing apples with oranges.
VIII. Twelve systems, the same yardstick
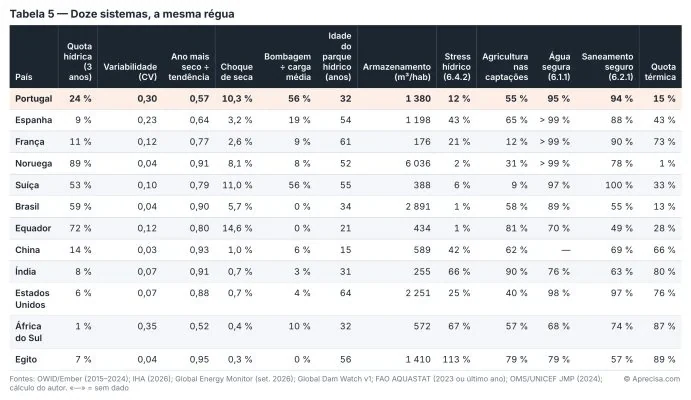
Table 5 sets twelve systems side by side, chosen for their diversity of size, climate and mix. It is read by columns, not by rows: no row has a final score. Norway is almost entirely hydro, has the largest storage per inhabitant in the sample and the lowest variability, and has no water stress. Ecuador has 72% hydro, little thermal reserve and small reservoirs for its system — and was one of those that ended up rationing in 2024. Egypt has stress of 113% and hardly depends on hydro for electricity. India has 90% of its withdrawals in agriculture and 80% thermal electricity, exposed to cooling water. Switzerland and Portugal have the same ratio between pumped storage and average load, with very different hydro shares. France combines the oldest hydro fleet in the European sample with the highest thermal share in the group, almost all of it nuclear and cooled by rivers.
IX. Portugal with the same yardstick
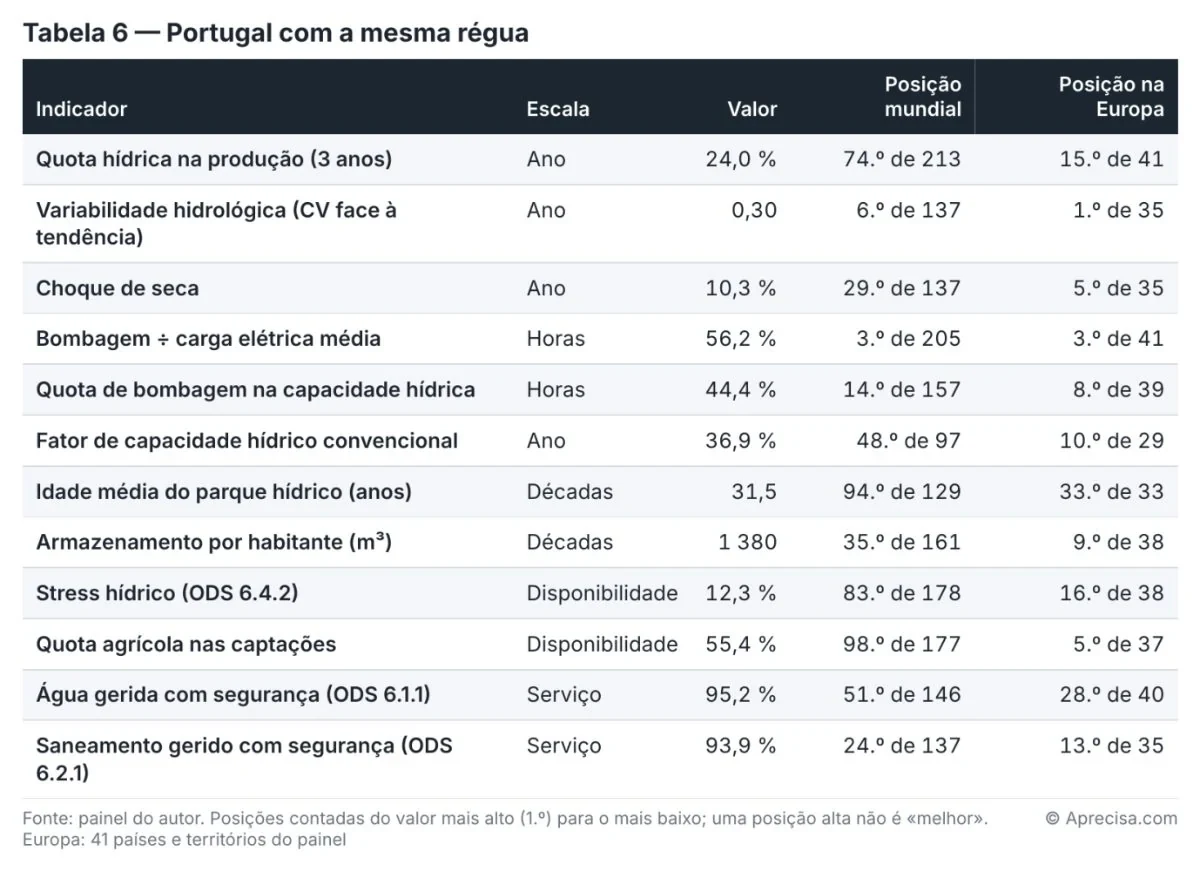
Table 6 places Portugal in the world and European distribution, with positions counted from the highest value to the lowest. Three rows stand out.
The first is variability. Among the 82 countries in which hydro accounts for at least 20% of electricity generation, Portugal has the most variable hydrology in the world, and it is first in Europe among the 35 with data. The five countries ahead of it in the complete world list have small hydro fleets, which do not exceed 13% of output. The second is pumped storage: the third highest ratio between pumping capacity and average load in the world, and the highest among systems whose pumped storage serves the country itself. The third is age: at 31.5 years weighted by capacity, Portugal has the youngest hydro fleet in Europe — the effect of the dam programme of the last two decades and of repowering with pumped storage.
On the water side, the picture is that of a country without stress on the national average — 12.3% under SDG 6.4.2, in 2023 — with real stress in the southern basins and an upstream dependence that the average does not show. According to the Portuguese Environment Agency (APA), about 70% of the water Portugal consumes comes from Spain through the international rivers. The Albufeira Convention and the Portuguese–Spanish summit of October 2024, which agreed the first regime of monthly flows on the Guadiana and principles of daily flow on the Tagus, are, in this reading, water infrastructure — as important as the dams.
Read together, this is a system that uses hydro more and more as a battery and less and less as a source of energy, with the most variable hydrology in Europe and a border that is at once electrical and hydrological. In 2022, both borders were called upon in the same half-year.
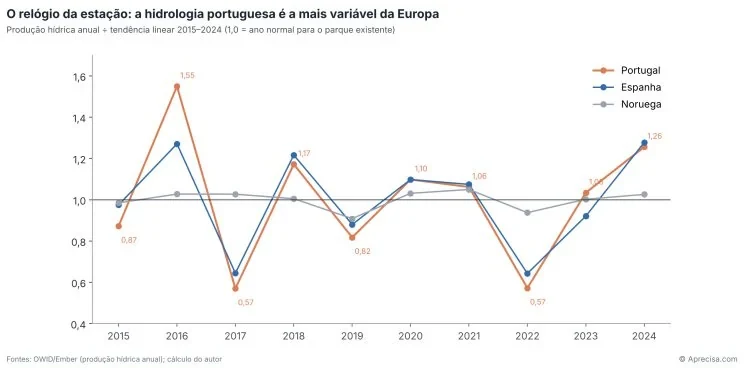
Figure 4 shows the ratio between each year’s hydro output and the 2015–2024 trend, for Portugal, Spain and Norway. Norway’s line barely moves away from 1. Spain’s swings between 0.64 and 1.28. Portugal’s goes from 1.55 in 2016 to 0.57 in 2017, returns to 0.57 in 2022 and rises to 1.26 in 2024: in ten years, two dry years at 57% of normal and one wet year at 155%. In the annual hydro share, this meant going from 27% of output in 2016 to 10% in 2017. No other European system with significant hydro swings so much.
X. The rules of the same yardstick for water
The rules of the electricity panel remain valid: one source per column, year declared, explicit denominator, no imputed value.
Water adds its own, because the inconsistencies I found in the sources are specific to it: the hydrological year, evaporation, the scope of pumped storage, withdrawal and consumption. Table 7 brings together the ten I followed.
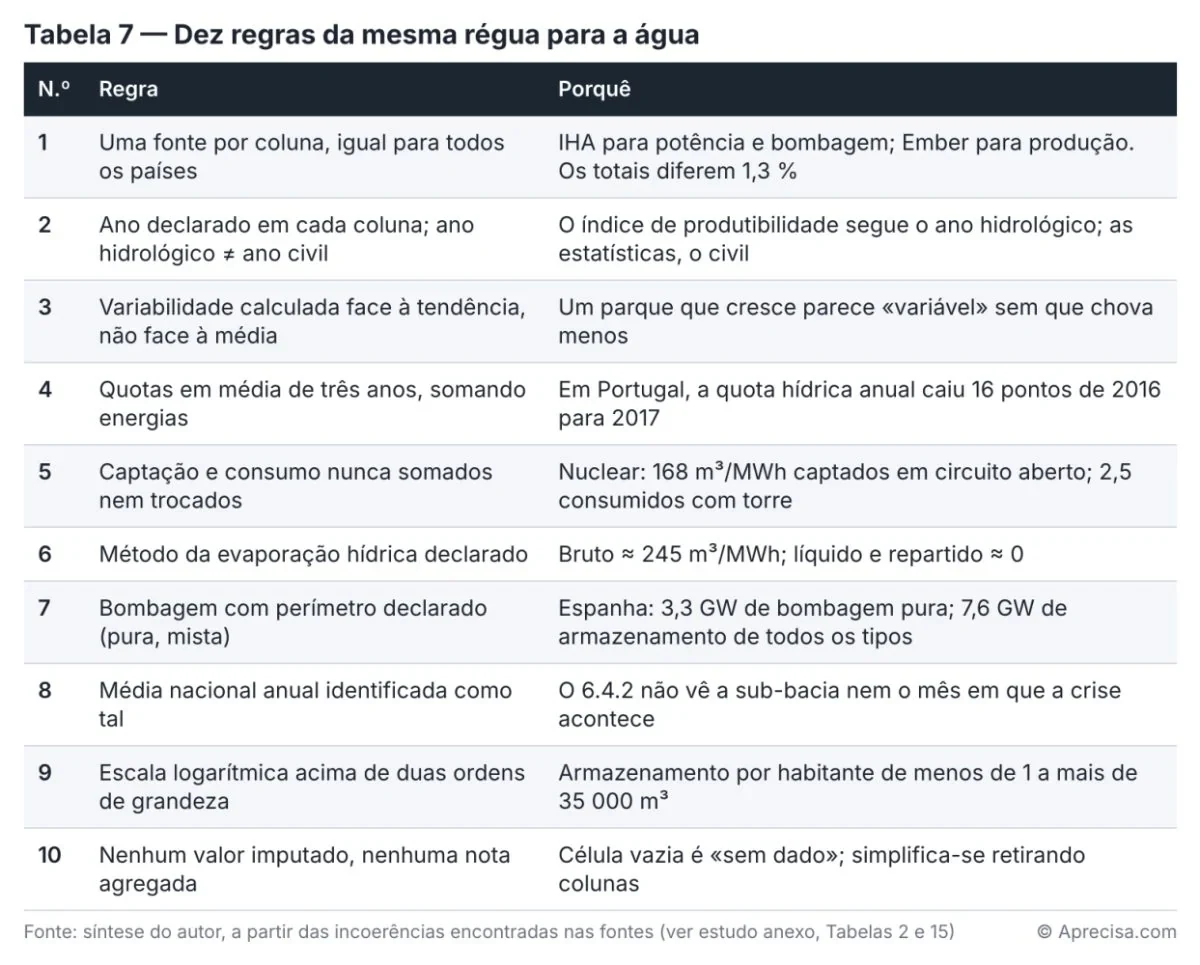
Table 7 states each rule next to the error it avoids. Two deserve highlighting. The third, calculating variability relative to the trend, changed the ranking of several countries: without it, the growth of the fleet passed for hydrological instability. And the tenth repeats the conclusion of the electricity panel: the panel has no aggregate score. A weighted sum of drought shock, safe water and water stress would have the appearance of rigour and the substance of an opinion.
Conclusion
I return to the dispatch centre of June 2022, because the question asked there now has an answer. How much of Portugal’s electricity depends on rain? About a quarter, on a three-year average. How much is missing in the worst year of the decade? About 10% of output, in a system whose hydrology is the most variable in Europe. What covers the shortfall? Pumped storage shifts energy between hours, but it does not create water; the shortfall of a dry year is covered with gas and imports — with the electrical border, in a season in which the water border also tightens.
The world shows the same on a large scale. Hydropower produces more than ever and weighs less than ever; its value is moving from energy to storage. Dams store water, but they do not create it. And the same water that drives the turbines cools the thermal power stations, supplies the cities and irrigates the fields — and, in a dry year, they all ask for it at the same time.
Open data are enough to measure the year and the service. They are not enough to measure the hour, the sub-basin and the month — and that is where crises happen. The panel that accompanies this article measures what can be measured, with the same yardstick, and says clearly what is missing.
The next time a country announces its renewable share, the engineer’s question should come before the applause: in which hydrological year?
Fewer averages. More dry years.
In plain language: An electricity system with a lot of water is like a house with a well: excellent in rainy years, put to the test in dry ones. The right question is not how much water the well gives on average, but how much it gives in the worst summer — and what is done that summer.
Gaspar do Amaral
Text, tables, figures and data panel by the author, AI-assisted in research and verification. © Aprecisa.com
Annotated references
A. By the author
- Amaral, G. (10/2026), Painel mundial água–energia — (“World water–energy panel”) spreadsheet with 214 countries and territories and 30 numerical indicators — attached to this article.
- Amaral, G. (10/2026), Medir a água e a hidroeletricidade com a mesma régua — (“Measuring water and hydropower with the same yardstick”) synthesis study on sources, indicators and comparability rules — attached to this article.
- Amaral, G. (10/2026), A energia não cabe numa régua só, LinkedIn — (“Energy does not fit on a single yardstick”) power, energy, orders of magnitude.
- Amaral, G. (10/2026), Duas horas ao fim da tarde, LinkedIn — (“Two hours at the end of the afternoon”) the scale of hours in the Iberian system.
- Amaral, G. (10/2026), Dez decibéis não são mais dez, LinkedIn — (“Ten decibels are not ten more”) the logarithmic scale.
B. Hydropower
- IHA (2026), 2026 World Hydropower Outlook — 1,469 GW, 201 GW of pumped storage, 28 GW put into service, 4,495 TWh; country annex used in the panel.
- Ember (2026), Global Electricity Review 2026 — world output and renewable share.
- energynews.pro (2026) — summary of Ember data — 4,437 TWh and a share of 14%, a record low.
- IEA (2021), Hydropower Special Market Report — ≈ 1,500 TWh stored in reservoirs; share of 17% in 2020.
- REN (2026), Dados Técnicos 2025 — Portugal’s capacity, pumped storage, output, consumption and production capability index.
- Iberdrola, Tâmega gigabattery — 1,158 MW and 40 GWh.
C. Water resources and service
- UN-Water, SDG 6 Data Portal — 6.4.2 — indicator 6.4.2 — world water stress of 17.59% (2023) and regional values.
- UN-Water, SDG 6 Data Portal — 6.1.1 — indicator 6.1.1 — safely managed water.
- WHO/UNICEF (2025), JMP 2025 — Progress on household drinking water, sanitation and hygiene — 74% and 58% in 2024.
- UNICEF, Sanitation — 3.4 billion without safely managed sanitation.
- FAO (2025), Water Data Snapshot — 72% of withdrawals in agriculture.
- Observador (2026) — on ERSAR’s RASARP 2025 report — 99% safe water; 27% non-revenue water (≈ 190 hm³).
- ECO (2022) — citing APA — ≈ 70% of the water consumed in Portugal comes from Spain.
- RTP (2024), Cimeira luso-espanhola — (Portuguese–Spanish summit) monthly flows on the Guadiana and principles of daily flow on the Tagus.
D. Droughts
- Ember (2023), European Electricity Review 2023 — EU hydro −19% in 2022; coal +28 TWh.
- Energías Renovables (2023) — REE data — Spain −39.7% in 2022.
- Postal do Algarve (2022) — citing REN — production capability index of 0.24 in June 2022.
- Revista Pesquisa FAPESP (2021), Shortage risk — Brazil: reservoirs at 35%.
- AP (2022) — Sichuan — industrial rationing.
- EIA, Today in Energy — US hydro output in 2023, the lowest since 2001.
- Zambian Digest (2024) — Kariba North at 98 MW out of 1,080 MW.
- Anadolu (2024) — Ecuador — power cuts of 14 hours a day.
- Catalan News (2024) — Catalonia — emergency in 202 municipalities.
- EDF (2022), Bilan été 2022 — low reservoirs and thermal limits of the rivers in the same summer.
E. Water–energy nexus
- Macknick, J., Newmark, R., Heath, G. & Hallett, K. C. (2012), Operational water consumption and withdrawal factors for electricity generating technologies, Environmental Research Letters 7 — withdrawal and consumption factors.
- Mekonnen, M. M. & Hoekstra, A. Y. (2012), The blue water footprint of electricity from hydropower, HESS 16 — gross method, ≈ 68 m³/GJ.
- Scherer, L. & Pfister, S. (2015), Water footprint of hydropower, ETH Zürich — for the IAI — net method and allocation across uses.
- US DOE (2017), Bandwidth Study on Energy Use in Seawater Desalination — 3.3 kWh/m³ (reverse osmosis) and 15 kWh-eq/m³ (MSF).
- IEA (2016), A delicate balance between water demand and the low-carbon energy transition — ≈ 4% of world electricity in the water sector.
- IEA (2023), Clean energy can help to ease the water crisis — ≈ 370 billion m³ withdrawn by the energy sector in 2021.
- Governo de Portugal (2024) — Algarve desalination plant — ≈ 16 hm³, €108 million.
F. Databases used in the panel
- Our World in Data, energy-data — hydro and total output, demand, population (Ember and Energy Institute data; CC BY 4.0).
- Global Energy Monitor, Global Integrated Power Tracker — (September 2026) age of hydroelectric power stations (CC BY 4.0).
- Global Dam Watch — GDW v1.0 database of dams and reservoirs.
- FAO, AQUASTAT — SDG 6.4.1 and 6.4.2 and sector contributions.
- WHO/UNICEF, JMP — data — 2025 world file.
G. Climate literature
- van Vliet, M. T. H. et al. (2016), Power-generation system vulnerability and adaptation to changes in climate and water resources, Nature Climate Change 6 — usable capacity of hydro and thermal plants in 2040–2069.
- Guerreiro, S. B., Kilsby, C. G. & Fowler, H. J. (2016), Rainfall in Iberian transnational basins, Climatic Change 135 — Douro, Tagus and Guadiana under RCP8.5.
Methodological note
All the numbers in the panel were calculated by the author from primary sources consulted on 11 October 2026. The spreadsheet that accompanies the article contains, for each column, the source, the year, the definition, the formula and the level of coverage.
1. Universe. 214 countries and territories with electricity demand and generation in the Our World in Data energy dataset (version frozen on GitHub, Ember and Energy Institute data). Matching between sources by ISO 3166-1 alpha-3 code.
2. Capacity, pumped storage and 2025 output. Country annex of the IHA’s World Hydropower Outlook 2026 (table “Installed capacity and generation 2025”), extracted from the PDF. Values “<1” recorded as 0.5 TWh. Zambia and Zimbabwe were left blank, because the alignment of the columns in the source is inconsistent (0 MW with 12 TWh and 3,176 MW with 0 TWh).
3. Pumped storage ÷ average load. Pumping capacity (GW) ÷ average electrical load, which is annual demand (TWh) ÷ 8.76. It is power, not storable energy.
4. Conventional capacity factor. 2025 output ÷ ((total capacity − pumped storage) × 8,760 h). It is an approximation: the source does not separate output from pumped water.
5. Three-year hydro share. Sum of hydro output in the three years up to the reference year (2024, or the latest available), divided by the sum of total electricity generation in those years. It is not the average of the three percentages.
6. Variability relative to the trend. For each country with at least eight years of positive output between 2015 and 2024 and an average above 0.1 TWh, a straight line was fitted to annual output by least squares; years with zero output were excluded as recording gaps. The ratio rt is the year’s output divided by the value of the line. Variability is the sample standard deviation of rt; the driest year is the minimum of rt. 137 countries meet the criteria.
7. Drought shock. Three-year hydro share × (1 − driest year ÷ trend). Fraction of electricity generation missing in the worst year of the decade, assuming demand stays the same. A derived physical quantity, not an index.
8. Age of the hydro fleet. 2026 minus the year of entry into service, weighted by capacity, of the hydroelectric power stations in operation in Global Energy Monitor’s Global Integrated Power Tracker (September 2026). For binational plants, the share attributed to each country was used.
9. Storage. Sum of reservoir capacity (CAP_MCM) in Global Dam Watch v1.0, by country, divided by the Our World in Data population. The main use of each dam is the one declared in the database.
10. Water stress and withdrawals. SDG 6.4.2 from FAO AQUASTAT, latest year available (2023 for most). FAO classes: no stress below 25%; low, medium and high up to 50, 75 and 100%; critical above 100%. Agricultural share = contribution of the agricultural sector to stress ÷ total stress, which is equivalent to the agricultural fraction of withdrawals.
11. Service. JMP 2025, year 2024: safely managed water and sanitation (SDG 6.1.1 and 6.2.1) and at least basic, national total. Values “>99” recorded as 99.5 and shown as “> 99%”.
12. Nexus. Factors from Macknick et al. (2012), North American medians, converted from gal/MWh to m³/MWh with 1 gal = 0.003785 m³. Electricity of the Algarve desalination plant: 16 hm³/year × 3.3 kWh/m³ ≈ 53 GWh/year, to be compared with REN’s 2025 consumption (53,044 GWh). Non-revenue water: ≈ 190 hm³ ÷ 16 hm³ ≈ 12.
13. Correlations and counts. Spearman rank coefficient: −0.34 between hydro share and variability (137 countries, p < 0.001); −0.12 between storage per inhabitant and stress (152 countries, p = 0.16). The population in countries with stress above 50% adds up national populations and is not equivalent to the population living in basins with that stress.
14. Positions. Counted from the highest value (1st) to the lowest, among the countries with data. “Europe” means the 41 European countries and territories in the panel. No position is a score.
15. Limits. The panel does not measure the energy storable in pumped storage, stress by sub-basin and by month, external dependence on flows, non-revenue water, or the water withdrawn and consumed by each country’s power fleet, for lack of an open world source or because the country data were not obtained. National and annual averages underestimate the stress of critical basins and seasons.
About this translation. A translation of the article the author published on LinkedIn on 11 October 2026; the full Portuguese version is on this site. The tables, formulas and charts are reproduced as in the original, with their texts in Portuguese, and with translated captions. The titles of the sources stay in their original language; only the annotations are translated.
The discussion is on LinkedIn (in Portuguese)
Comments on this text are made on LinkedIn, where the article was shared in Portuguese. You are welcome to write in English. Agree, disagree or add data: every well-founded objection receives a reply.
Gaspar do Amaral · Original in Portuguese of 11 October 2026, published on this site; translation issued on 27 October 2026 · Figures and tables © Aprecisa.com · AI-assisted