 ← Grupo Aprecisa · Connecting those who know with those who need
Engineering · Energy · Opinion
Eight warnings
What the official security-of-supply reports have said since 2018 — and why the European yardstick says the opposite
Gaspar do Amaral · 13 October 2026
Translated from the Portuguese original. This version was issued on 27 October 2026.
On this site, this article has been
In 2018, the Direção-Geral de Energia e Geologia (DGEG, Portugal’s Directorate-General for Energy and Geology) published, on the basis of studies by REN (Redes Energéticas Nacionais, the operator of the Portuguese transmission grid), a report containing a sentence that went almost unnoticed. If the coal-fired power stations of Sines and Pego and the gas-fired power station of Tapada do Outeiro were closed, “the power available to cover peak demand will cease to be adequate in 2025”. The coal-fired stations closed in 2021. Tapada do Outeiro is still running thanks to successive extensions. And the report published in June 2026 says that the “breaking point” (estádio de rutura) arrives this very year.
In technical discussions on security of supply, a recurring scenario is a shortfall of 2 GW over five days without wind or sun. The natural objection is that the 2 GW is a hypothesis. This article shows that it is not. It is, with small variations, the figure that the official Portuguese reports have been repeating for four years. It also shows something surprising: the European assessment, approved by the agency of the regulators (ACER) in April 2026, reaches the opposite conclusion. For Europe, Portugal has no adequacy problem.
I read the eight editions of the Relatório de Monitorização da Segurança de Abastecimento do Sistema Elétrico Nacional (RMSA-E, the Security of Supply Monitoring Report for the National Electricity System), from 2018 to 2025, the 2025 European assessment with its annexes, the ACER decision and the ERSE (Entidade Reguladora dos Serviços Energéticos, Portugal’s energy regulator) report on the value of energy not supplied. I also calculated, from the hourly file published by ENTSO-E, when and how energy would run short in Portugal and in Spain in the European model.
In practice: There are two official yardsticks for measuring whether Portugal will have enough electricity at the worst moments. The Portuguese one says it no longer does. The European one says it does. The difference decides whether or not the country can pay power stations to stand in reserve.
The words in this article
Security of supply has a vocabulary of its own. These are the words the article uses, each with what it means and an everyday example to help remember it.
Power and energy. Power is measured in watts (kW, MW, GW) and is the strength at one instant; energy is measured in watt-hours (kWh, MWh, GWh) and is the quantity accumulated over time.
In everyday life: Power is the width of the tap; energy is the water left in the bucket. A 2 kW heater switched on for half an hour uses 1 kWh.
Installed capacity. The sum of the maximum power of all the power stations in the country.
In everyday life: It is the number of seats on a bus: it says how many fit, not how many will travel.
Firm capacity. The part of the capacity that can be counted on at the worst moment, after discounting breakdowns and the lack of wind, sun or water.
In everyday life: A team has 25 registered players, but on match day, with injuries and suspensions, it can count on 15. A solar panel at eight o’clock on a winter evening counts as zero.
Peak demand. The hour when the country consumes the most. In Portugal, at the end of the afternoon on cold winter days, about 10 GW.
In everyday life: It is dinner time in a restaurant: it is that hour, and not the average for the day, that decides how many tables and cooks are needed.
Adequacy. Having enough means to meet the peak with a margin, even with breakdowns and bad weather.
In everyday life: The restaurant is adequate if it can serve Saturday dinner even if a cook is missing.
Peak coverage index (ICP). Available power divided by the peak, with a probability of 95% or 99%. Below 1, it is not enough.
In everyday life: A hundred chairs for 110 guests give 0.91: ten people are left standing.
Loss of load expectation (LOLE). The average number of hours per year in which the available means are not enough for demand and for reserves.
In everyday life: How many nights a year, on average, the restaurant has to turn customers away for lack of tables.
Expected energy not supplied (EENS). The quantity of energy that is missing in those hours.
In everyday life: It is not how many nights customers were turned away, but how many dinners went unserved.
Reliability standard. The maximum number of hours of shortfall per year that the country accepts. In Portugal, since 2025, 1.46 hours.
In everyday life: It is the maximum number of absences the school allows before the pupil fails the year.
Stress test. The simulation of the system as it exists, without counting on anything that is not yet under construction.
In everyday life: It is looking at the pantry before a storm and asking: if I buy nothing more, how long will it last?
Interconnection. The lines that connect the Portuguese grid to the Spanish one.
In everyday life: It is the door to the neighbour: it only helps if, on that day, the neighbour has something to lend.
Balancing reserve (mFRR). Power kept back to come in within minutes when something fails. Since 2022, part of it is bought at auction from large consumers, who agree to reduce their consumption.
In everyday life: It is the firefighter on standby at the station: paid to be there, even on days when there are no fires.
Interruptibility and load shedding. Interruptibility is the reduction of consumption agreed with, and paid to, large consumers. Load shedding is cutting the power by zones to save the rest of the grid.
In everyday life: On a ship taking on water, the cargo agreed in advance is thrown overboard first; if that is not enough, compartments are closed off.
Value of lost load (VoLL). How much each MWh that a consumer goes without is worth to them. In Portugal, 12,433 €/MWh: about €12 per kWh, against the roughly €0.23 paid on the bill.
In everyday life: The fridge’s kWh costs a few cents; the food spoilt by a power cut costs much more.
Cost of new entry (CONE). How much it costs, per year, to have 1 kW of reserve ready to run.
In everyday life: It is the annual car insurance premium: it is paid whether or not there is an accident.
Energy-only market. Power stations are paid only for the energy they sell.
In everyday life: It is a taxi that is paid only for its journeys. Reserve taxis for New Year’s Eve would spend the rest of the year parked and without income, and nobody would buy them.
Capacity mechanism. A payment for availability, per MW and per year, in exchange for the obligation to be ready when the grid needs it.
In everyday life: It is the retainer paid to the emergency plumber: paid every month so that he answers on a Sunday night when a pipe bursts.
I. The national yardstick
The RMSA-E is published by the DGEG and incorporates REN’s analysis, which it includes as an annex. It simulates the electricity system hour by hour, with 40 different hydrological regimes, random breakdowns in the generating units and several scenarios for demand and installed capacity. It measures security of supply with two indicators. The first is the probabilistic peak coverage index (ICP): the ratio between the available power and peak demand, with a probability of 95% or 99%; below 1, the peak is not covered. The second is the loss of load expectation (LOLE): the number of hours per year in which, on average, the available means are not enough for demand and for reserves.
Each edition includes a “stress test”: the system as it exists, plus what is under construction or starts being built by the end of the year, without counting on any other project. It is the simplest and hardest question that can be asked: if nothing more is built, when does the system stop being enough?
Up to the 2024 edition, the national standard was 5 hours per year of loss of load expectation. In 2025, Portugal adopted the European reliability standard, calculated by ERSE according to the ACER methodology: 1.46 hours per year. The limit of tolerated hours of shortfall fell from 5 to 1.46 per year, less than a third of the previous one.
In practice: The stress test is the question put to the pantry before a storm: if I buy nothing more, how long will it last? And the new standard is demanding: on average, less than an hour and a half a year without power — less than a soccer match lasts.
II. Eight warnings
Table 1 brings together the central conclusion of the stress test of each edition.
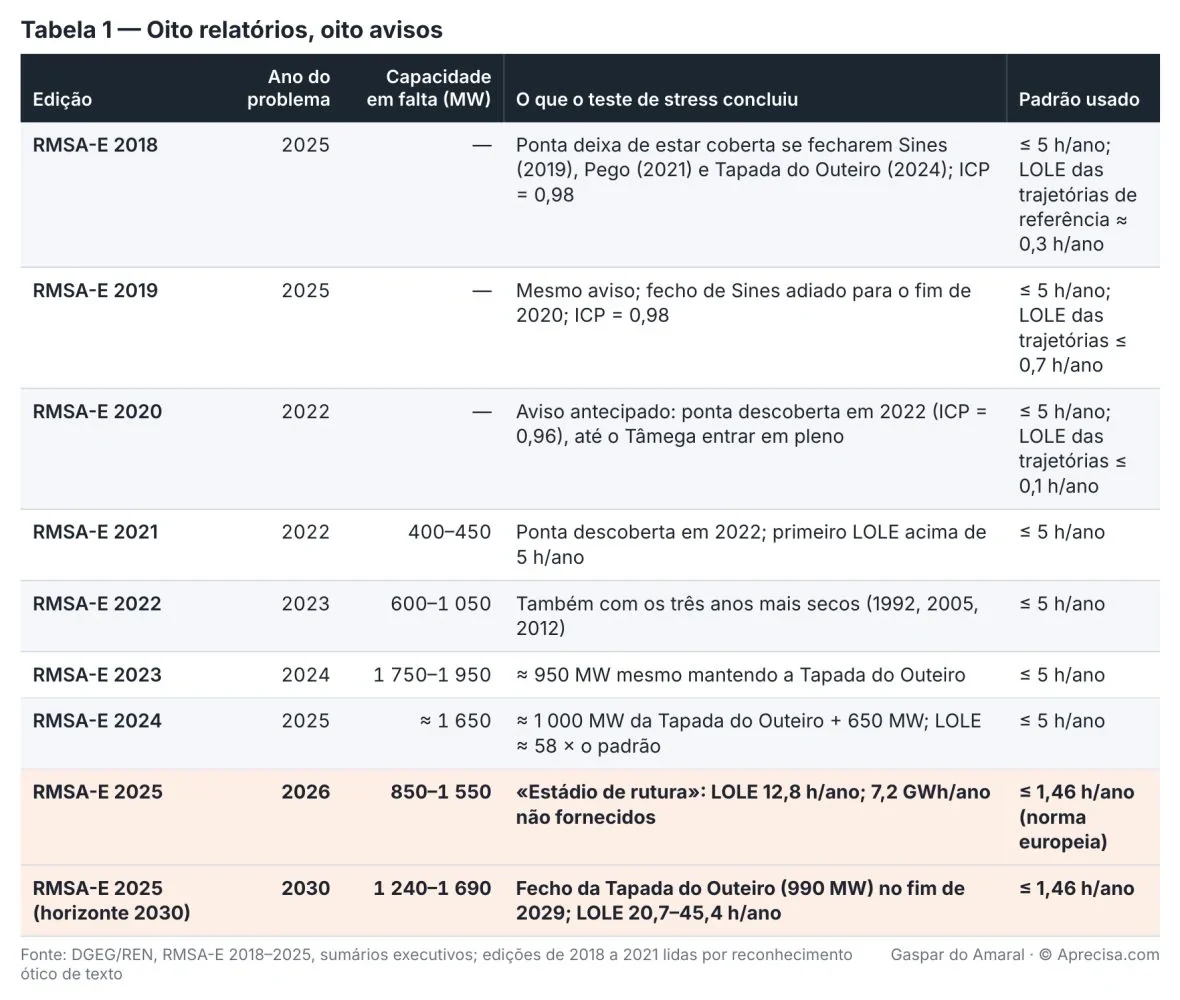
Read from top to bottom, the table tells a story. In the first three editions, the reference trajectories gave almost zero loss of load, below one hour per year, but the stress test was already warning: without the coal-fired stations and without Tapada do Outeiro, the peak would no longer be covered. In 2020, the year of the problem moved from 2025 to 2022. From 2021 onwards, the reports began to quantify the missing capacity: 400 to 450 MW, then 600 to 1,050, then 1,750 to 1,950, then about 1,650. In 2025, with the new standard, the shortfall for 2026 was between 850 and 1,550 MW, and that for 2030 between 1,240 and 1,690 MW.
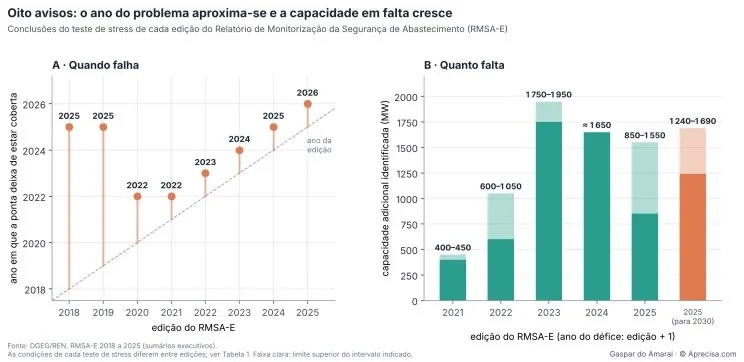
Figure 1 sums up the table in two images. On the left, each dot marks the year in which, according to each edition, the peak would no longer be covered; the dashed line is the year of the edition itself. The distance between the dot and the line is the warning time: seven years in 2018, one year from 2021 onwards. On the right, the bars show the additional capacity that each edition considered necessary; the light part is the upper limit of the range given. The figure has only one reading: since 2021, each report has warned about the following year, and what is missing is of the order of 1,000 to 2,000 MW. The sequence should not be read as a statistical series. The conditions of the stress test change from edition to edition (power stations considered, interconnection, hydrology, standard), and the table records them.
Tapada do Outeiro, a 990 MW combined-cycle gas power station, is the piece that keeps coming back. The 2023 edition concludes that, even keeping it beyond the end of its power purchase agreement, about 950 MW would be missing. The 2024 edition counts on it and still asks for another 650 MW. The 2025 edition assumes it is running until 31 December 2026, the deadline set by the Ministério do Ambiente e Energia (Ministry of Environment and Energy) for yet another extension, and even so finds the system at breaking point.
In practice: It is like the fuel warning light on a car’s dashboard. In 2018 it came on to warn that there were seven years left. Since 2021 it has come on every year to say that it is the very next year. What is missing is the power of one or two power stations the size of Tapada do Outeiro.
III. 2026: the breaking point
The RMSA-E 2025 was published on 5 June 2026, with the 2026–2040 horizon. The stress test for 2026 gives a loss of load expectation of 12.8 hours per year and 7.2 GWh per year of energy not supplied. That is almost nine times the standard.
To cover the shortfall, REN studied the needs for manually activated frequency restoration reserve (mFRR) capacity, the reserve that today includes industrial interruptibility, assuming that only 10% of the interconnection capacity with Spain would be available. It concluded that 850 to 1,550 MW of additional guaranteed capacity were needed. The 7th mFRR capacity auction was held. According to the erratum published by the DGEG, part of the capacity put up for auction was not awarded. REN’s comments on the European assessment add one piece of data: recent auctions for this product awarded, at most, about 400 MW, “although the needs of the system are much greater”.
If the shortfall materialises, the report provides for three measures, in this order: asking the Spanish operator to activate a support programme; reducing the consumption of industrial customers with an interruptibility contract; and, if these do not comply, shedding non-priority loads according to the protocol between the grid operators. The last measure is, in everyday language, cutting the power to some of the consumers.
In practice: Imagine a lift whose inspection requires that it is not out of service for more than an hour and a half a year, and which, by the manufacturer’s own calculations, will be out of service for almost thirteen. If the shortfall comes, the plan is that of a building without water: first you ask the neighbour, then you ask those who use the most to turn off the tap and, finally, the water is cut off to some floors.
On 15 June 2026, ten days after publication, the Government announced the preparation of a capacity mechanism, open to generation, storage and demand management, and the start of pre-notification to the European Commission.
IV. 2030 and beyond
For the following years, the report analyses two trajectories: the Conservative and the Ambition trajectory, the latter aligned with the Plano Nacional de Energia e Clima (PNEC, Portugal’s National Energy and Climate Plan). Even with all the interconnection available, the loss of load expectation remains above the standard in every year analysed.
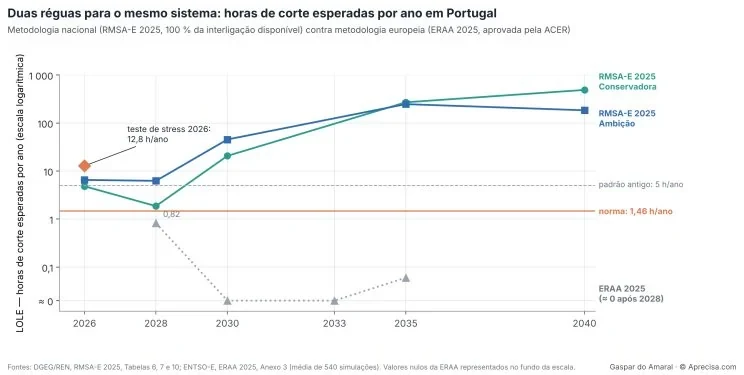
Figure 2 shows, on a logarithmic scale, the expected hours of disconnection per year according to the two official methodologies. The green and blue lines are the two trajectories of the RMSA-E 2025, with 100% of the interconnection available; the diamond is the 2026 stress test. The orange line is the standard of 1.46 h/year; the dashed one, the old standard of 5 h/year. The dotted grey line is the European assessment. Between 2028 and 2030, the two yardsticks move apart by a factor of more than a thousand: the national one rises to 20 to 45 hours per year, the European one falls to practically zero. The figure does not say which of the yardsticks is right. It says that they cannot both be.
The jump from 2028 to 2030 has two causes, according to the report: the closure of Tapada do Outeiro at the end of 2029 and the increase in demand. If only 10% of the interconnection is available, the loss of load expectation in 2030 rises to about 58 hours per year in the Conservative trajectory and to 198 in the Ambition one. In 2035 and 2040 it exceeds 180 hours per year in every trajectory, driven by the consumption of electrolysers, data centres and heavy industry. And if all the combined-cycle gas power stations closed in 2030, the loss of load would exceed 500 hours per year: “in several simulated hours and for different climate years the system is in deficit against peak demand”. The report itself concludes that these power stations must be kept as firm power.
The report also contains a conclusion that almost nobody has talked about. The National Energy and Climate Plan (PNEC) promises that, in 2030, 93% of the electricity consumed in Portugal will come from renewable sources. In none of the trajectories studied does the country get there: it stays at 92%, 86% or 57%, depending on the path followed. The two conclusions of the report — firm capacity is missing and the renewable target is missed — do not contradict each other; they explain each other. The sun and the wind produce a lot over the year, but they are not present in every hour. In the hours when they are missing, the electricity has to come from gas, from water or from Spain. Those are the hours that put security of supply at risk, and those very same hours prevent the target from being met.
In practice: It is like a pupil who promises to score 93 in the exam and who, by the teacher’s own calculations, scores 92 at best and 57 at worst. The promise is not impossible, but none of the paths studied gets there.
In practice: Imagine two scales weighing the same person: one shows 70 kilograms, the other 70 grams. You do not need to know which is right to realise that one of them is badly wrong. From 2028, the two official yardsticks move apart like that, more than a thousand times. The European one weighs light because it counts on the neighbour always being at home to lend; the national one weighs heavy because it forecasts a demand that has not yet arrived. Before deciding how much to pay for the insurance, the country has to know which scale it trusts.
V. The European yardstick says something else
Since 2019, the European regulation on the internal market for electricity (Regulation (EU) 2019/943) has required ENTSO-E, the association of European grid operators, to carry out every year a European resource adequacy assessment (ERAA). ACER approves or amends it. The 2025 edition was approved, with amendments, by Decision 06/2026, in April 2026. For Portugal, it gives 0.82 hours per year of loss of load expectation in 2028 and practically zero in 2030, 2033 and 2035. ACER notes that, for 2028, the range between the two variants of the model goes from 1 to 6 hours, against a standard of 1.46, and it refused precisely to allow the result to be presented as a range, as it did not give a clear signal.
The consequence is legal before it is technical. A Member State may only create a capacity mechanism if the European or the national assessment identifies an adequacy problem. As the European one did not identify it, the RMSA-E 2025 was adapted to the European methodology so that it could serve as a national assessment and justify the mechanism. It was this adaptation, the report itself says, that delayed its publication.
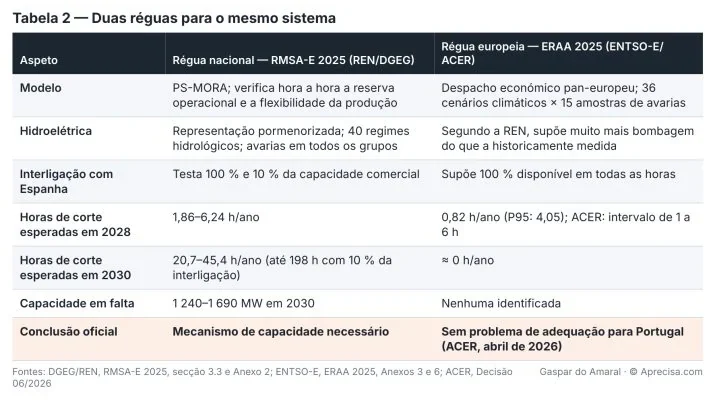
Why do the two yardsticks diverge? REN explains it in writing, in the country comments annexed to the European assessment. There are two main reasons. The first is that the European model assumes much more pumping in the existing power stations than has historically been measured. The second is that it assumes that 100% of the interconnection capacity with Spain is always available for commercial exchanges, which does not happen in real operation. REN adds that the European assessment used an average standard of 3 h/year for Portugal, because the country had not yet published the standard according to the approved methodology, and that it estimated a demand response potential of 855 MW, when the Portuguese auctions did not go beyond about 400 MW.
The national yardstick also has limits that the report itself acknowledges. In the version adapted to the European methodology, only six of the 36 climate years of the European assessment were simulated. And the results depend on demand scenarios with strong growth in electricity-intensive consumption that has yet to be confirmed.
There is, however, one point on which the two yardsticks agree, and it is the most important. The economic viability assessment of the ERAA itself concludes that a significant part of the Portuguese combined-cycle power stations is not profitable in the energy-only market: in 2028, depending on the approach, between 1,770 and 3,060 MW of the existing 3,829 MW would be decommissioned. REN concludes from this that a capacity payment mechanism may be necessary. The two yardsticks disagree on whether capacity is missing today. They agree that the firm capacity that exists does not pay for itself.
In practice: The European yardstick counts on the neighbour always being at home to lend and on the pumped-storage reservoir always being full. The Portuguese one knows that, on the bad day, the neighbour may also have nothing and the reservoir may be half empty. On one point they agree: gas power stations are like the fire truck — nobody pays for it by the kilometres it does; it is paid for to be ready.
VI. When it runs short, in the European model
ENTSO-E publishes a file with the energy not supplied hour by hour, in each zone, for each of the 540 simulations (36 climate scenarios × 15 outage samples). I analysed it for Portugal and Spain. The results are in Table 3 and Figure 3.
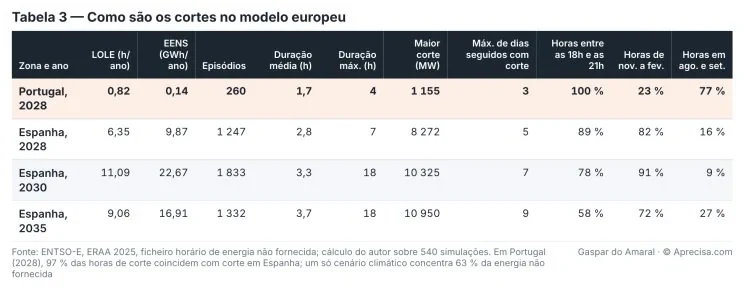
Table 3 sums up the episodes of disconnection. In Portugal, the episodes of disconnection last 1.7 hours on average and never more than 4; the largest disconnection is about 1,150 MW. In 97% of the hours of disconnection in Portugal, Spain is also in disconnection, which confirms that the interconnection does not save the day when the shortfall is Iberian. A single climate scenario concentrates 63% of the energy not supplied in Portugal: the loss of load expectation is the average of many years with nothing and a few bad years. In Spain, the episodes reach 18 hours in a row and, within one simulation, there are up to 9 consecutive days with some disconnection.
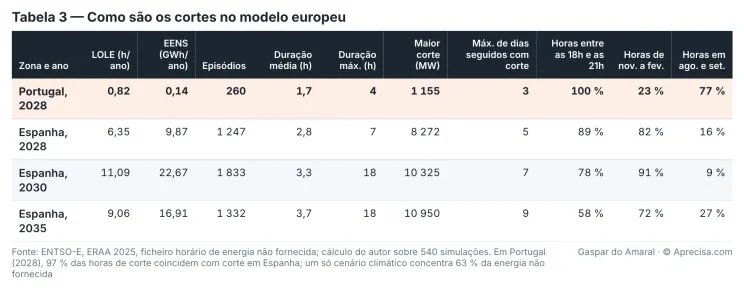
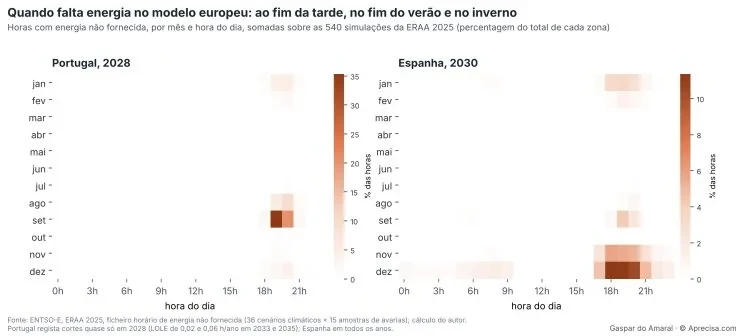
Figure 3 shows in which month and at what hour of the day the hours with energy not supplied occur, as a percentage of the total of each zone. On the left, Portugal in 2028, the only year with relevant disconnections in the European model; on the right, Spain in 2030. In Portugal, all the hours of disconnection fall between 18:00 and 21:00, and three quarters of them in August and September: the end of the day, when the sun disappears, at the end of the dry season, with the reservoirs at their lowest. In Spain, the bulk of the disconnections is in the late afternoons from November to January, with a tail into the early hours in December. The figure shows that the risk the European model sees in the Peninsula is not the whole week without wind: it is the hour of sunset, repeated on consecutive days.
The numbers confirm it. In Portugal, the episodes of disconnection last 1.7 hours on average and never more than 4; the largest disconnection is about 1,150 MW. In 97% of the hours of disconnection in Portugal, Spain is also in disconnection, which confirms that the interconnection does not save the day when the shortfall is Iberian. A single climate scenario concentrates 63% of the energy not supplied in Portugal: the loss of load expectation is the average of many years with nothing and a few bad years. In Spain, the episodes reach 18 hours in a row and, within one simulation, there are up to 9 consecutive days with some disconnection.
This calls for a more nuanced reading of that scenario. For the disconnections the European model finds (two to four hours in the late afternoon), batteries of two to four hours are an adequate answer, provided they can be recharged between one late afternoon and the next. For five consecutive days of continuous deficit, the quantity of energy to be stored makes batteries a very expensive solution. But that is not the pattern of the disconnections in the European model. The pattern is a sequence of difficult late afternoons. And the question becomes whether, on winter days with little wind and little sun, there is energy at midday to recharge the storage before the next peak. That is exactly what the national yardstick, with more detail on hydropower and on the operating reserve, says there may not be.
In practice: In the European model, the electricity shortage is not a week in the dark: it is a squeeze of two or three hours at the end of the day, when the sun sets and consumption is still high. For that, a battery works well: it is like the mobile phone that is charged during the day and lasts through the night. The problem is several grey, windless days in a row: if there is no energy left over during the day for charging, by the late afternoon the battery is already empty.
VII. What not cutting is worth
The standard of 1.46 h/year is not arbitrary. It results from a calculation by ERSE, with the support of two consultancies, published in December 2025. The first step is to estimate how much an interruption costs a consumer, by survey: the value of lost load (VoLL) is 3,442 €/MWh for domestic consumers, 16,105 €/MWh for non-domestic consumers and 12,433 €/MWh as a weighted average for mainland Portugal. For comparison, the value calculated in Spain was 22,879 €/MWh. The second step is to estimate the annual cost of keeping available each kW of each reserve technology, the so-called CONE (cost of new entry). The third is to divide one by the other: the result is the hours of disconnection per year from which it pays to buy more reserve.
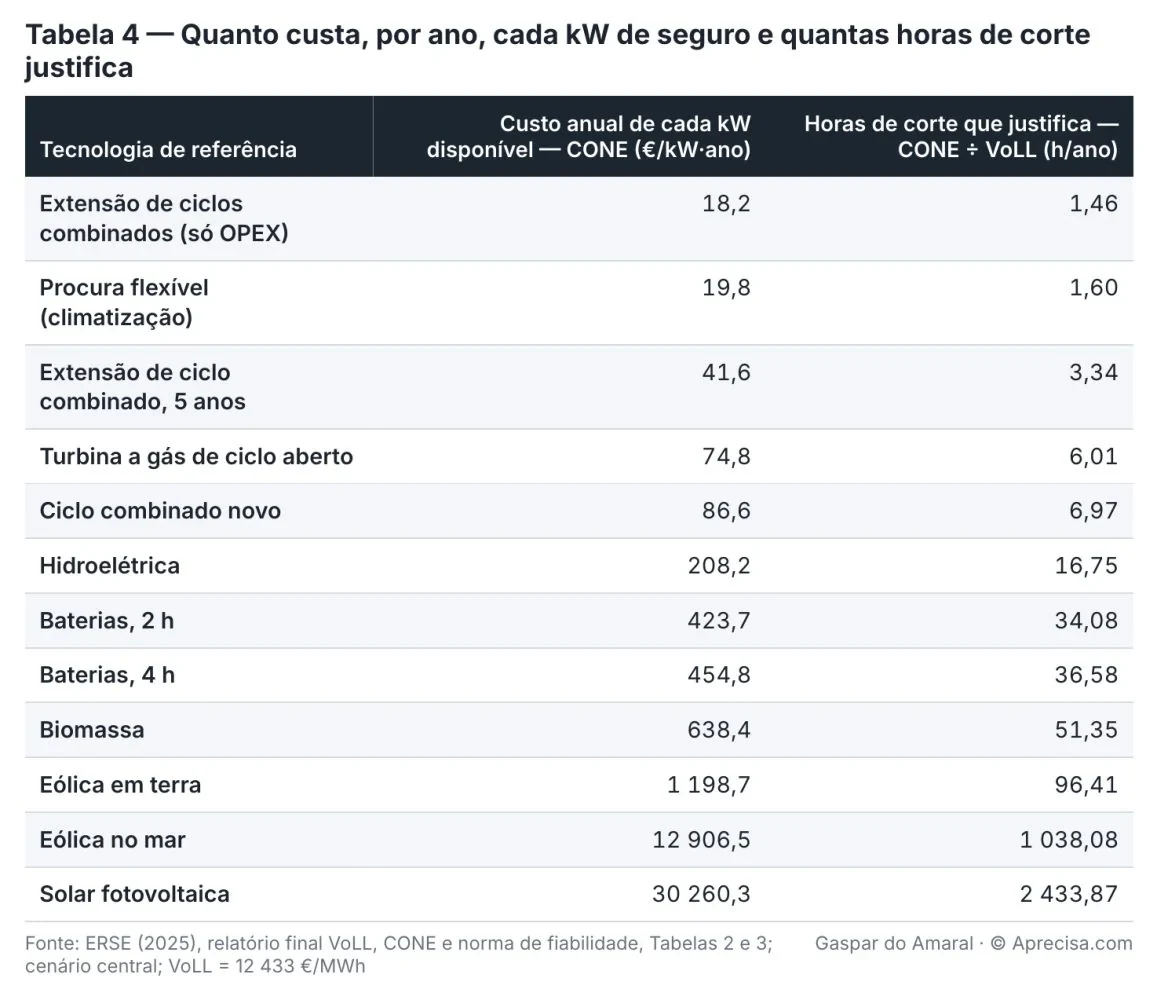
Table 3 is, in practice, a price list for insurance. Keeping the combined-cycle power stations that already exist, paying only for their operation, costs 18.2 €/kW per year, and it was that technology that set the standard of 1.46 h/year. A new open-cycle gas turbine costs 74.8 €/kW per year. A four-hour battery costs 454.8 €/kW per year, six times more. These are the regulator’s figures, not estimates by an interested party.
The table should be read with two cautions. The value for non-domestic consumers rests on 246 validated interviews and was not weighted sector by sector, as ERSE itself points out; the 12,433 €/MWh is an estimate with a margin of error. And the flexible demand potential considered, about 0.7 GW of air conditioning, shifts consumption for a few hours; it is not equivalent to stopping industry for days.
In practice: It is the sum done by someone deciding whether to buy a generator for the restaurant: how much they lose for each hour without power, against how much it costs per year to have the generator ready. For a home, each kWh that is missing is worth about €3.4; for a business, about €16. And the cheapest insurance is the one that already exists: keeping a gas power station costs 18.2 € per kW per year; a new battery costs 25 times more.
VIII. Capacity: paying to be ready
In an energy-only market, each power station is paid for the MWh it sells. A power station that is needed in only a few dozen hours a year does not recover, from those hours, either the investment or the maintenance. Economists call it the “missing money” problem. In theory, the very high prices of the scarcity hours would pay the difference; in practice, those prices have limits and are politically hard to accept. The result is in the European assessment itself: between 1,770 and 3,060 MW of the 3,829 MW of Portuguese combined cycles are not profitable in 2028 and would close.
In practice: Nobody keeps a taxi parked all year waiting for New Year’s Eve. If the city needs those taxis that night, it has to pay them to be available — or accept that there will be no taxis.
A capacity mechanism pays, in addition to the energy, for availability: an amount per MW and per year, in exchange for the obligation to be available when the grid operator asks, with penalties for those who fail. The quantity to be bought follows from the reliability standard; the price results, as a rule, from an auction. Each technology counts for its firm capacity: a de-rating factor is applied that reflects how much it contributes, on average, in the critical hours. A gas power station counts almost in full; a two-hour battery counts partially; wind and solar count for little.
In practice: It is the retainer paid to the emergency plumber: paid every month so that he answers on a Sunday night, and if he does not answer he loses the retainer. And each one is paid for what they guarantee: a plumber who answers only half the time receives half.
There are three main forms. In the centralised market, the grid operator buys the capacity at auction, years in advance; it is the model of Great Britain, Italy, Belgium, Poland, Ireland and, now, Spain. In the decentralised obligation, each supplier has to buy certificates covering the peak of its customers; it is the French model. In the strategic reserve, some power stations leave the market and are called only in an emergency; it is the model of Germany, Sweden and Finland. Table 5 compares the cases.
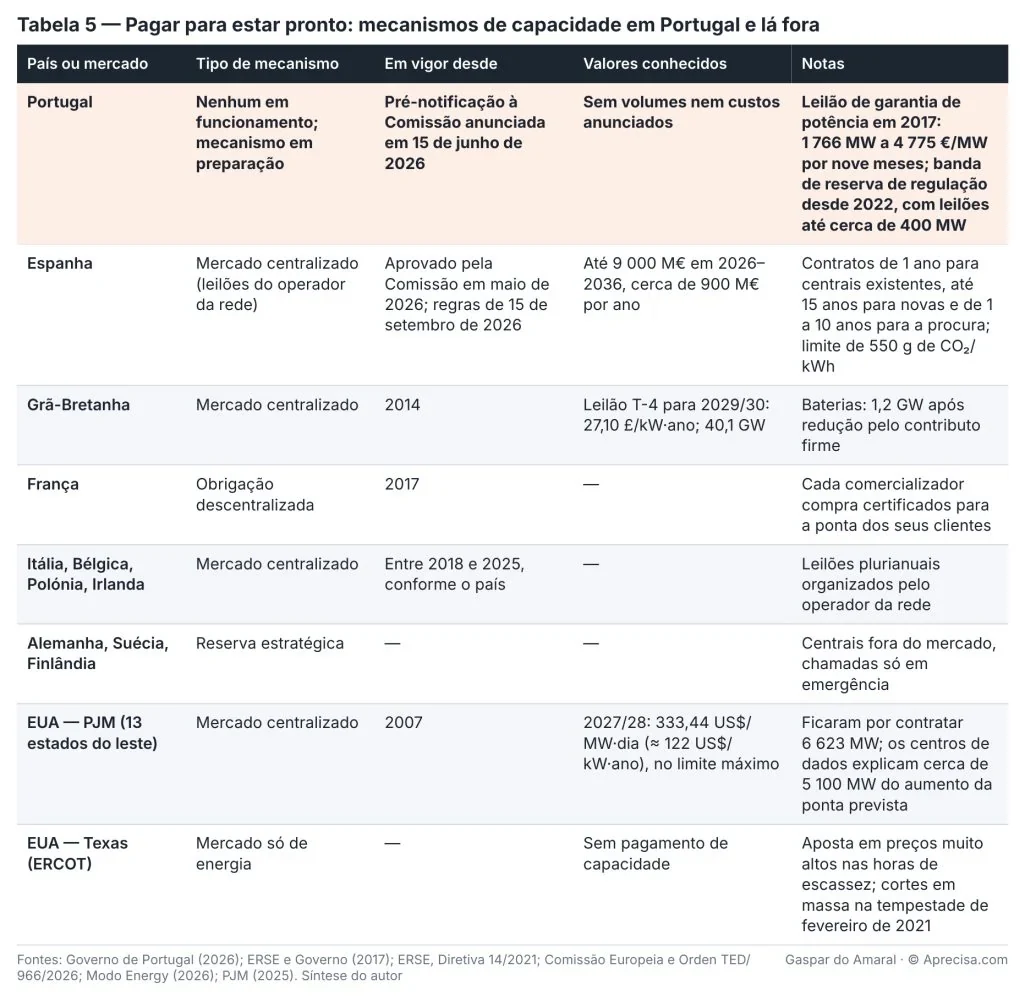
European rules are tight. Regulation (EU) 2019/943 only allows a capacity mechanism if an adequacy assessment identifies a problem, requires a reliability standard, obliges it to be open to all technologies — generation, storage and demand —, sets an emissions limit of 550 g of CO₂ per kWh, which rules out coal-fired power stations, and provides for the participation of capacity from other countries. Each mechanism is State aid and needs the approval of the European Commission.
In Portugal, the story is short and intermittent. Until 2017, power stations received an incentive for capacity guarantee set administratively. That year, an auction awarded 1,766 MW at 4,775 €/MW for the last three quarters, at a cost of less than €5.7 million, against about €12.9 million under the previous regime; it did not become a permanent mechanism. In 2022, the interruptibility service was replaced by a market for balancing reserve capacity, open to large consumers, whose auctions did not go beyond about 400 MW. On 15 June 2026, the Government announced the preparation of a competitive capacity mechanism, open to generation, storage and demand management, and the start of pre-notification to the Commission. No volumes, costs or dates were announced.
In Spain, the road has already been travelled. The Commission approved in May 2026 a mechanism of up to €9,000 million for 2026–2036, about €900 million per year. Orden TED/966/2026, of 15 September, sets the rules: main auctions up to five years in advance, annual adjustment auctions and transitional auctions; contracts of one year for existing power stations, up to fifteen years for new power stations and from one to ten years for demand; loss of payments with a 20% surcharge and exclusion after three failed tests. The de-rating factors, the financing and the date of the first auction are still to be defined.
Outside Europe, the two extremes are American. In PJM, the largest electricity market in the United States, the auction for 2027/28 closed at the maximum price, 333.44 US$ per MW per day, about 122 US$ per kW per year, and even so 6,623 MW were left uncontracted; almost all the increase in forecast peak comes from data centres. In Texas, the market is energy-only and relies on very high prices in the scarcity hours; in February 2021, a winter storm left millions of people without electricity for days.
Portugal stands out on three points. The first is legal: the European assessment does not identify an adequacy problem in the country, and the national assessment had to be adapted to ground the mechanism. The second is scale: what is missing, 850 to 1,550 MW in 2026, corresponds to one or two power stations, in a market with few possible competitors, which makes the auction less competitive. The third is the neighbourhood: with Spain paying for capacity and Portugal not yet, the firm capacity of the Peninsula has a buyer on one side of the border and not on the other, and the Spanish mechanism plans to open, later, to the participation of interconnected countries.
In practice: Spain already pays the plumber his retainer; Portugal is still deciding. If the plumber lives on the border, on Sunday night he answers first those who pay him.
IX. What remains to be measured
The two yardsticks are models, not measurements. The next step is to compare them with what actually happened: go through the real hourly series of wind, solar and hydro generation, of demand and of exchanges with Spain over the last ten years, and count how many times there were late afternoons or weeks when the margin was minimal, how long they lasted and who covered them. The data are public, on the ENTSO-E transparency platform. I did that count in «As piores semanas que já tivemos» (“The worst weeks we have ever had”): in twelve years of hourly data there were 20 lulls of four or more days, and the one holding them up is more and more Spain — the hours importing more than 3 GW went from one in 2015 to 1,562 in 2026. It is precisely the assumption that the European yardstick relies on and that the data show not to be guaranteed. The same count remains to be done for the late-afternoon peak hours alone.
There are also three questions that the documents do not answer. The first is how many hours of reduced margin the system has already lived through since the closure of the coal-fired power stations, without disconnections. The second is how much interruptibility would cost if it had to last days and not hours. The third is how the two yardsticks are to be reconciled before the capacity mechanism reaches Brussels, where the European yardstick will carry weight.
In practice: The models are the weather forecast. The measured data are the thermometer. Before deciding how much to pay for the insurance, it is worth going to see what the thermometer has shown over the last ten years.
How to know which scale to trust: six steps
- 1. Weigh a known kilo. Have the two yardsticks forecast the twelve years already lived and see which of them recognises the tight days that actually happened, such as the late afternoon of 12 January 2021 or the drought with a lull of October 2022.
- 2. Swap the parts between scales. Run the European model with the real interconnection, the historical pumping and the 400 MW of demand, one assumption at a time, and the national one with the 36 climate years, to find out which of them explains the difference.
- 3. Measure the neighbour. Measure, hour by hour, the import capacity offered and Spain’s margin on cold, windless late afternoons, in a joint assessment by REN and REE.
- 4. Count those enrolled, not those announced. Forecast new demand only with approved connection requests and signed contracts, the way the school canteen is planned by the pupils enrolled.
- 5. Open up the scales. Publish the data and assumptions of both models and ask for an independent review before the mechanism reaches Brussels.
- 6. Meanwhile, decide what is cheap to correct. Keep the existing combined cycles, at 18.2 €/kW per year; one-year contracts for existing power stations; long contracts only for new capacity and only after the yardsticks have been reconciled; buy in tranches.
Before buying an expensive insurance policy, you weigh a known kilo on both scales and ask the neighbour, with numbers, whether they will be at home on the worst Sunday night. Until then, you keep the cheap insurance you already have.
Conclusion
Since 2018, the official Portuguese reports have warned that, without new firm capacity, peak demand will no longer be covered. The year of the problem was always brought forward and the shortfall grew from 400 to about 1,700 MW. In June 2026, the report declared the “breaking point” for that very year, and the Government announced a capacity mechanism. The European assessment, approved by ACER, says there is no problem, and REN explains why: it assumes more pumping than the real one and an interconnection that is always available.
The two yardsticks agree on the essentials. The gas power stations that exist are the cheapest reserve, and the market on its own does not pay for them. They disagree on the rest, and it is in the rest that how much we are going to pay is decided. The worst week is no longer a hypothesis: it is the conclusion of eight official reports. What remains to be known is whether we are going to get through it with power stations paid to wait or with a load-shedding protocol.
In one sentence. For eight years the official reports have been warning that Portugal will need 1 to 2 GW of firm reserve; the European yardstick says no, and on that disagreement depends who pays for the electricity in the worst late afternoon of the year.
Gaspar do Amaral
Text, tables, figures and calculations by the author, AI-assisted in the research, the extraction of the reports and the checking. © Aprecisa.com
Methodological note
National reports. I read the executive summary and the security-of-supply analysis sections of the eight editions of the RMSA-E, from 2018 to 2025, published by the DGEG. The 2018 to 2021 editions are in scanned format; I extracted the text by optical character recognition and checked each value cited against the image of the page. From the 2022 to 2025 editions I extracted the text directly. For the RMSA-E 2025 I used the erratum published by the DGEG, which corrects pages 11, 42 and 75 regarding the result of the 7th mFRR capacity auction. The values in Table 1 and Figure 1 are those of the stress test of each edition; when the edition gives a range, I record it; when it gives more than one condition (for example, with and without Tapada do Outeiro), I record the main one and mention the other.
European assessment. The loss of load expectation values of the ERAA 2025 for Portugal (average of 0.82 h/year in 2028, with a 95th percentile of 4.05 h/year; 0.00, 0.02 and 0.06 h/year in 2030, 2033 and 2035) are those of Annex 3, after the sharing of disconnections between zones. The range of 1 to 6 h/year in 2028 is the one referred to by ACER in Decision 06/2026. REN’s comments are in Annex 6.
Hourly file. The file ERAA_2025_HourlyENSData lists, for each target year (2028, 2030, 2033, 2035), each climate scenario (1 to 36), each outage sample (1 to 15) and each zone, the hours with energy not supplied and the corresponding value in MWh. I calculated: the loss of load expectation as the number of hours with disconnection divided by 540; the expected energy not supplied as the sum of the MWh divided by 540 (the values match those of Annex 3); an episode as a sequence of consecutive hours with disconnection in the same simulation; the maximum of consecutive days as the largest number of consecutive calendar days with at least one hour of disconnection in the same simulation; simultaneity as the fraction of the hours of disconnection in Portugal in which, in the same simulation and at the same hour, there is disconnection in Spain. The distributions by month and hour in Figure 3 count hours with disconnection, not energy.
Value of lost load and CONE. The values in Table 3 are those of the central scenario of ERSE’s final report of December 2025 (Tables 1 to 3). The hours of disconnection that each technology justifies result, according to the ACER methodology, from dividing the CONE by the VoLL: for example, 18.2 €/kW·year ÷ 12,433 €/MWh × 1,000 = 1.46 h/year.
Limits. All the numbers in this article are results of official models, not measurements of what happened. The conditions of the stress tests changed from edition to edition, so the sequence in Figure 1 shows the evolution of the warnings, not a homogeneous series. I did not analyse the demand scenarios of each edition or the complete technical annexes; the conclusions cited are those that the reports themselves highlight.
About this translation. A translation of the article the author published on LinkedIn on 13 October 2026; the full Portuguese version is on this site. The five tables and three figures are the original images, with their texts in Portuguese, and a translated caption that gives their title, what they show and their source; the original repeats Table 3, and the translation shows what the reader of the original sees. The original cover is replaced by a translated cover. The table numbers cited in the text are those of the original. The last everyday example of the glossary, which the original shows as a heading, appears in the same box as the others. The names of Portuguese bodies and reports stay in Portuguese, with an explanation in brackets the first time they appear. The titles of the sources stay in their original language; only their annotations are translated.
References
- DGEG, Monitorização da Segurança de Abastecimento — [A. National security-of-supply reports (DGEG/REN)] page with all the editions.
- RMSA-E 2025 (2026–2040) — published on 5 June 2026 — breaking point in 2026, 12.8 h/year; needs of 1,240–1,690 MW in 2030; erratum (original in Portuguese).
- RMSA-E 2024 (2025–2040) — 18 February 2025 — ≈ 1,650 MW in 2025.
- RMSA-E 2023 (2024–2040) — 22 December 2023 — 1,750–1,950 MW in 2024.
- RMSA-E 2022 (2023–2040) — 25 October 2022 — 600–1,050 MW in 2023.
- RMSA-E 2021 (2022–2040) — 400–450 MW in 2022.
- RMSA-E 2020 (2021–2040) — peak uncovered in 2022 (ICP = 0.96).
- RMSA-E 2019 (2020–2040) — peak uncovered in 2025 (ICP = 0.98).
- RMSA-E 2018 (2019–2040) — peak uncovered in 2025 (ICP = 0.98).
- ENTSO-E, ERAA 2025 — Reports & Results — [B. European assessment] executive report, Annexes 1 to 7 and hourly file of energy not supplied.
- ACER, Decisão 06/2026 sobre a ERAA 2025 — approval with amendments; range of 1 to 6 h/year for Portugal in 2028.
- ERSE, Segurança de Abastecimento — [C. Reliability standard and value of lost load] final report of December 2025: VoLL of 12,433 €/MWh, CONE by technology, standard of 1.46 h/year.
- ACER, Decisão 23/2020 — methodology for calculating the VoLL, the CONE and the reliability standard.
- Governo de Portugal (15 de junho de 2026), Governo prepara mecanismo de capacidade — [D. Political decisions] pre-notification to the European Commission; auction of 750 MVA of batteries.
- Governo de Portugal (2026), Governo prepara mecanismo de capacidade… — [E. Capacity mechanisms] 15 June 2026: competitive mechanism, open to generation, storage and demand; start of pre-notification.
- Governo de Portugal (2017), Primeiro leilão de garantia de potência — 1,766 MW at 4,775 €/MW; cost of up to €5.68 million, against €12.9 million under the previous regime.
- ERSE (2021), ERSE aprova diretiva que cria mercado de banda de reserva de regulação — Directive 14/2021; replaces the interruptibility service from 1 January 2022.
- Energy-Storage.news (2026), EU approves Spain's €9 billion capacity market — ten years, about €900 million per year; generation, demand and storage.
- DLA Piper (2026), Spain launches its new capacity market — Orden TED/966/2026: types of auction, durations, penalties, limit of 550 g of CO₂/kWh.
- Modo Energy (2026), leilão T-4 da Grã-Bretanha para 2029/30 — 27.10 £/kW·year; 40.1 GW.
- PJM (2025), PJM Auction Procures 134,479 MW of Generation Resources — 2027/28: 333.44 US$/MW·day, at the cap; 6,623 MW left uncontracted; data centres.
- Gaspar do Amaral (2026), As piores semanas que já tivemos — [F. Measured data] twelve years of electricity in Portugal, hour by hour, from ENTSO-E: lulls, imports from Spain and use of the gas power stations (original in Portuguese).
The discussion is on LinkedIn (in Portuguese)
Comments on this text are made on LinkedIn, where the article was shared in Portuguese. You are welcome to write in English. Agree, disagree or add data: every well-founded objection receives a reply.
Gaspar do Amaral · Original in Portuguese of 13 October 2026, published on this site; translation issued on 27 October 2026 · Figures and tables © Aprecisa.com · AI-assisted